flowcharts
-
How To Choose The Perfect Chart That Communicates Your Message

If I have to make a chart to communicate information, I usually just go with the old pie chart, right? Wrong. There are a million different types of tables and each has their own strengths and weaknesses. This flow chart is a great tool to help you decide which is most useful specific to your…
-
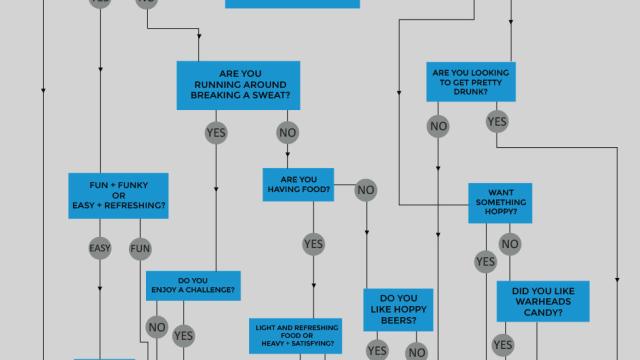
Decide What Style Of Beer You Want To Drink With This Flow Chart
There are so many types of beer out there that it can be tough to decide what you want to imbibe. This handy flow chart is here to help you with that.

-
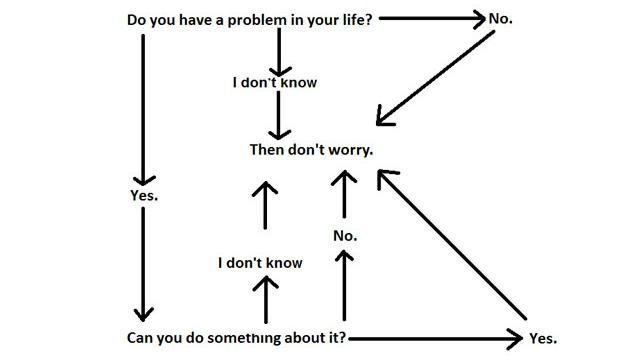
This Flowchart Tells You When To Worry About Anything
Stress can be terribly damaging. Although it’s normal to get stressed every so often, much of what we worry about doesn’t come to pass. This illustration could help keep things in perspective.
-
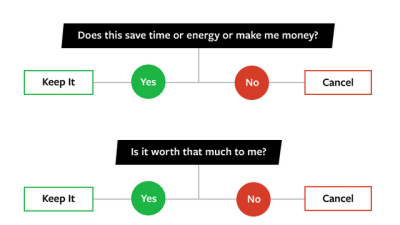
Get Motivated With The Procrastination Equation Flowchart
The next time you feel unmotivated, consult this handy flowchart for a cure. Based on the book The Procrastination Equation by Piers Steel, the chart guides you to do one of four things associated with motivation and defeating procrastination.