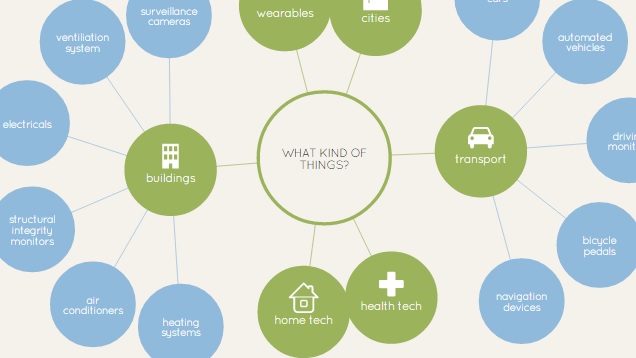
If you’re still trying to wrap your head around what the “Internet of Things” is, this data visualisation makes things easy to understand and is fun to explore.
The visualisation, from the team at Information is Beautiful, does a great job of explaining what the Internet of Things is, what it can and will affect, who the major players are, and even provides some eye-opening statistics regarding the direction we’re all headed with technology. Additionally, it mentions some of the challenges facing our “always connected” world. You can check it out at the link below.
The Internet of Things [Information is Beautiful]
Comments
One response to “Learn About The Internet Of Things With This Interactive Visualisation”
I understand its adding network connectivity, automation and off site control to items and processes which have previously been purely offline.
Why is it called “Internet of Things”…the name itself sounds stupid
Agreed. I mean sure it’s descriptive.
But I hate it. I just. No. Nope.