In our last instalment, I started experimenting with sleep tracking in hopes of recovering better for my weightlifting sessions. I’ve used the Oura ring and Whoop band, but today I’ll talk mainly about Oura — my favourite of the two — and about what metrics I found useful.
As we discussed last time, sleep is important for athletic recovery. After a particularly hard workout, your body needs to repair itself. Depending on how much strain you put on your body, that process can take days to weeks. Any trainer will tell you that consistently getting enough sleep is probably the best thing you can do to support your recovery. (Eating well is a close second, and everything else — massage, ice baths, supplements — pales in comparison.)
[referenced id=”1043070″ url=”https://www.lifehacker.com.au/2021/01/how-im-using-sleep-tracking-to-improve-my-fitness/” thumb=”https://www.gizmodo.com.au/wp-content/uploads/sites/4/2021/01/16/ix96hbfrwy35usheb7w9-300×169.jpg” title=”How I’m Using Sleep Tracking to Improve My Fitness” excerpt=”For the past few months, I’ve been wearing an Oura ring to track my sleep. In December, I added a Whoop band for comparison’s sake. I was curious about them because I’ve seen so many athletes — professional and recreational — say they use devices like these to monitor how…”]
I have almost three months of Oura data at this point, as well as my own workout logs and assorted other tracking data. Oura provides a web-based interface for graphing your data at cloud.ouraring.com, which I used to check some of the trends I’ve been noticing, and I’ll include screenshots from there and from the app itself in this piece. So let’s see what I found.
What Oura measures
The Oura ring fits on your finger — it’s a literal ring, and looks like a piece of ordinary jewellery — and has sensors inside that can pick up your heartbeat, your temperature, and motion. From the data it gathers, the app calculates various scores and metrics. For example, it can measure your lowest heart rate during the night, but it also notes what time of night that occurred. It combines several different metrics to give you an overall score for your sleep each night, and for your “readiness” each morning. (Gizmodo’s review gets deeper into the features, if you’re curious.)
The Oura ring can sort of track exercise — it increases my activity points when I take a walk — but if you want that data to be really accurate, you might want to use another tracker or manually input your workouts. For example, I can track a strength training workout on my Apple Watch, or I can take off all my trackers and just tell the app afterward that I lifted for two hours.
(While the ring is comfortable enough for everyday use, it’s too chunky to be comfortable when you’re pulling on a barbell. I take my Oura ring and my wedding rings off when I lift. Some people don’t mind the feel and keep their rings on during workouts; others take them off to make sure the finish won’t get scratched. Up to you.)
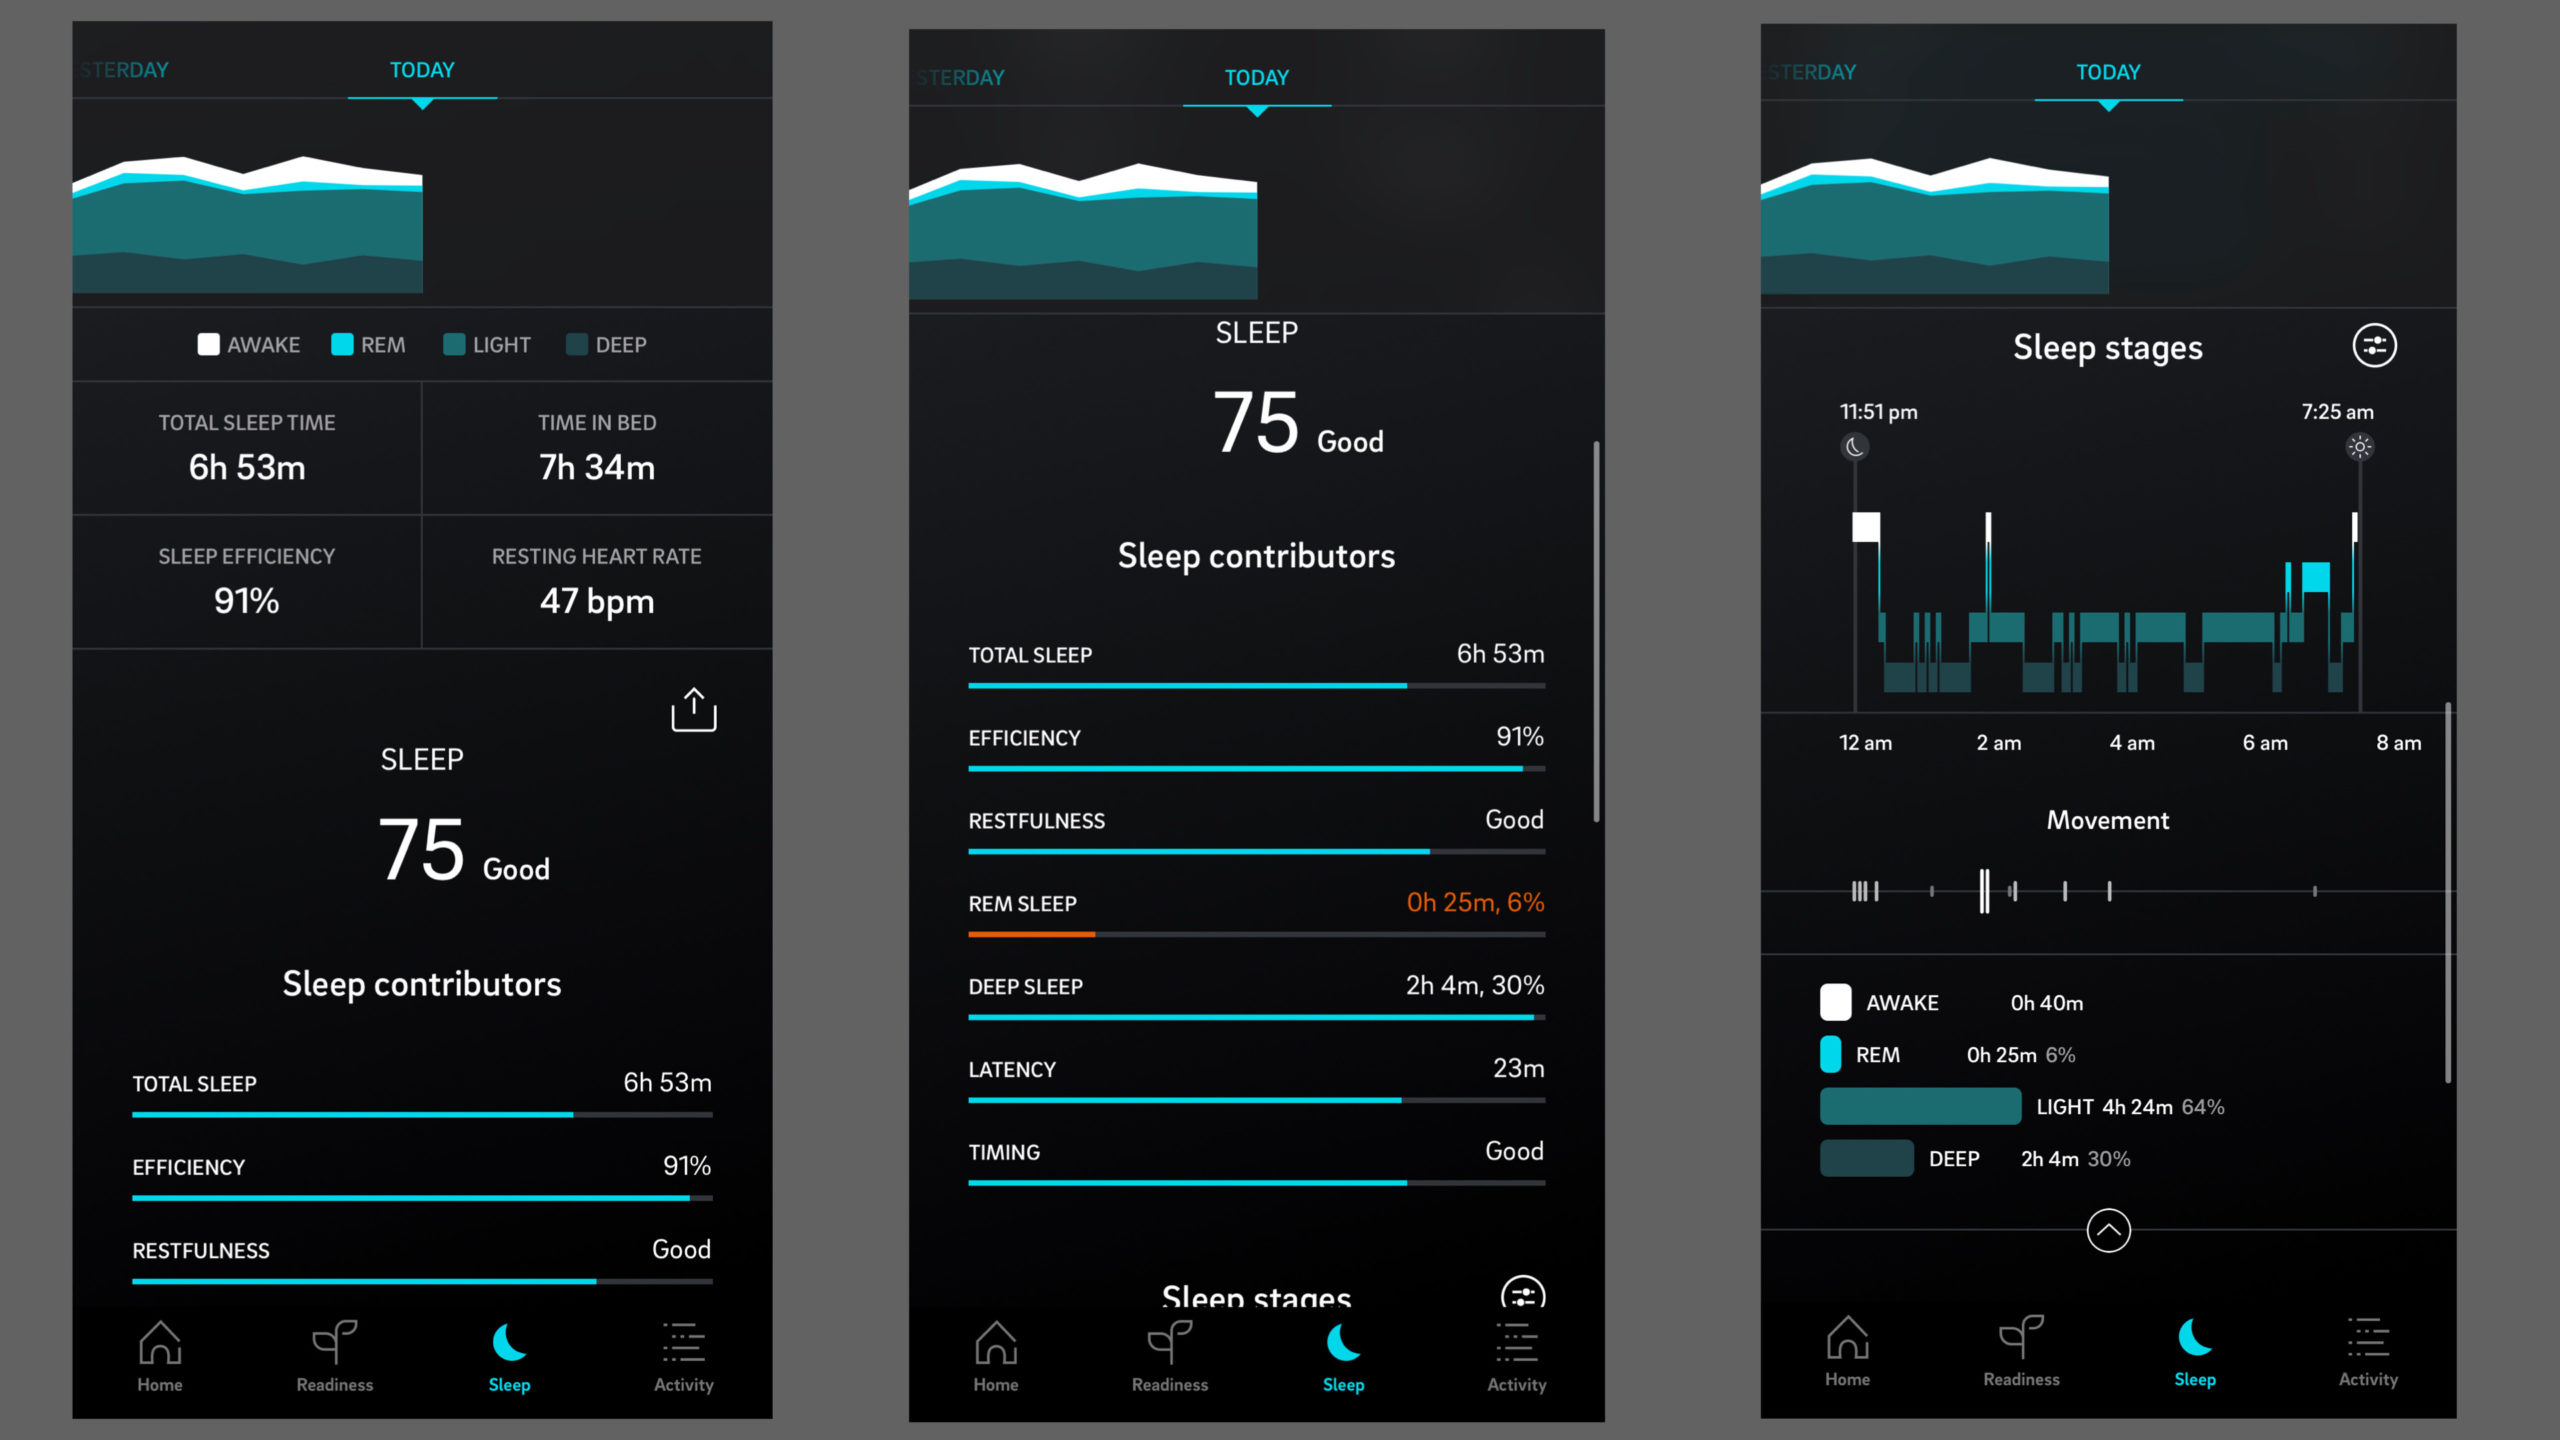
During sleep, Oura’s sensors measure your resting heart rate, your heart rate variability, your body temperature, and your respiratory rate. They can also tell when you’re moving around versus totally zonked out, and from all the metrics they can make some pretty good guesses about when you’re asleep, and even when you enter each stage of sleep. We bounce between deep sleep, light sleep, and REM sleep several times each night, and in the morning you can see all of these in a graph.
The metrics I pay attention to
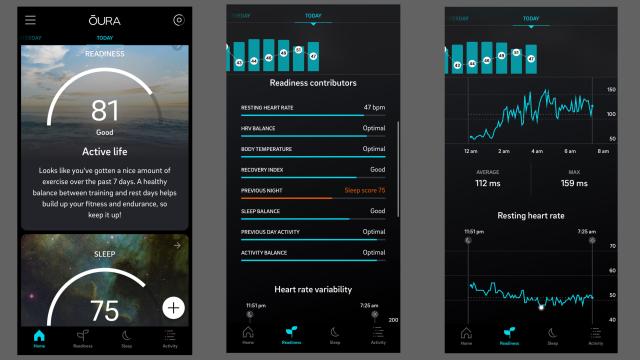
Every day, the app gives you a readiness score and a sleep score. (There is also an activity score, although you don’t see that unless you navigate to the activity tab.) Readiness is the number you see first on the app’s home screen, and it incorporates everything else. Your sleep score and your recent activity are rolled into it.
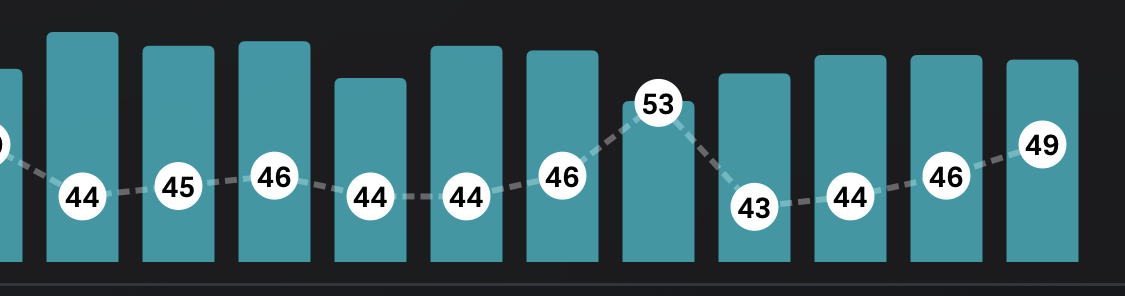
Of all the graphs and metrics on the app, the thing I consistently find most useful is the graph on the readiness screen. It shows the readiness score as a bar graph, with an overlay of each day’s resting heart rate.
In the olden days, before sleep trackers or digital fitness trackers were even a thing, I knew about resting heart rate. A lower RHR goes along with better cardio fitness, so it’s fun to watch it go down as you train. But if your RHR suddenly jumps up, that can be a sign that you’re working too hard. Overtraining syndrome can cause a higher than usual resting heart rate; so can illness or stress.
(A quick note on these numbers: while my resting heart rate in the graph is indeed on the low side — which is considered a good thing — that’s also the lowest heart rate that the ring detects all night. Our heart rates dip down pretty low when we sleep. As I’m sitting here writing, with some caffeine in my system and bouncing my leg under the desk, my pulse is about 60. If I were sitting quietly, it might be in the 50’s. A normal nighttime low for me is in the mid to high 40s. Years ago, when I was training for a half-marathon, it was routinely in the low 40s.)
On this graph — looking more at RHR than readiness, honestly — I can clearly see the rhythms of my training week. I do my normal workouts on weekdays, then my heaviest day on Saturday, and I rest on Sundays. My resting heart rate creeps up throughout the week — that 53 up there is a Saturday — and resets as soon as I have a rest day.
A few weeks ago, I decided to start giving myself a mid-week break. On Wednesdays, instead of lifting, I go for an easy run. My resting heart rate will sometimes drop a bit that night. I don’t have enough data to say for sure, but I think this keeps my RHR from peaking as high at the end of the week. In other words, I’m pretty sure that the mid-week break is actually doing its job of giving me some bonus recovery time. It also means that I’m spreading out my rest a bit, rather than Sunday being the only time I take it easy.
How the metrics correlate
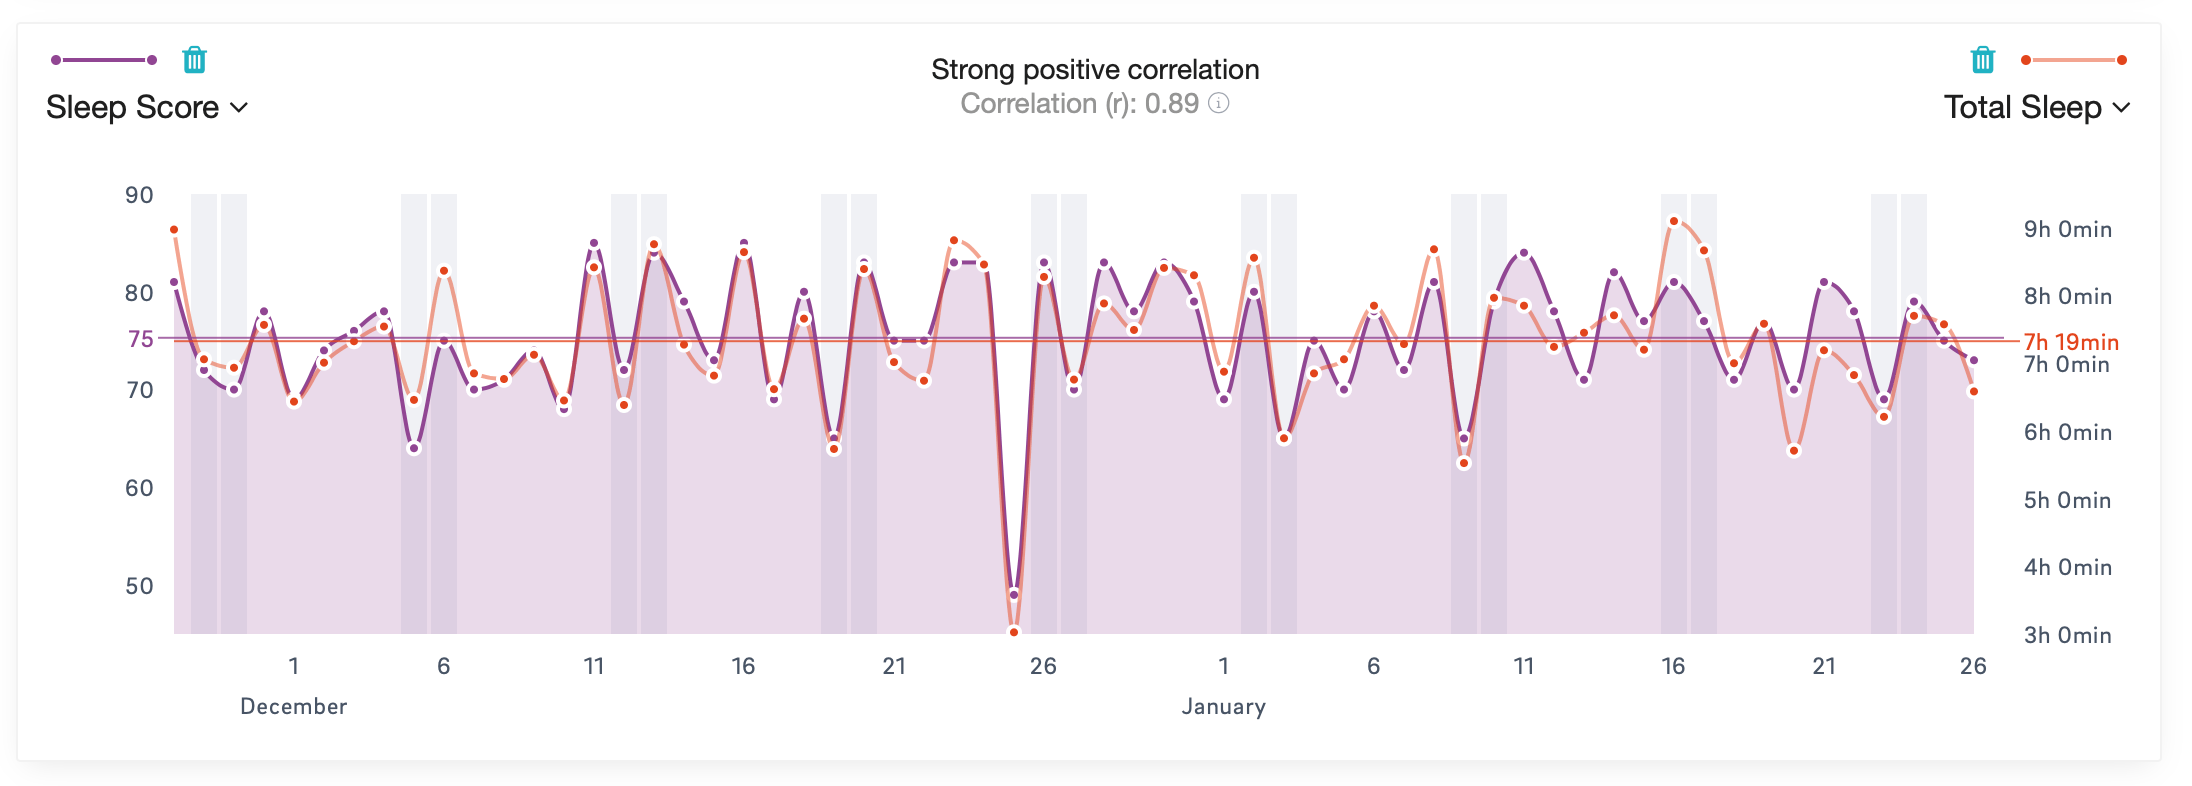
One question that was always on my mind as I wore this $US300 ($391) (yes) ring, was: could I obtain this information in another way? In the case of the sleep score, the answer is probably yes. While a number of factors go into it, including efficiency (how much of the night you spend asleep), restfulness (how much you move), latency (how long after lying down you fall asleep), and the amount of REM and deep sleep, the biggest factor for me was simply the amount of sleep I got. Here’s a graph from Oura Cloud showing how my sleep score compared to my total sleep:
There are, of course, other ways to find out your total sleep. You can keep a notebook by your bed and jot down when you turn in and when you wake up. Or you can have a less-specialised gadget, like a FitBit, keep track for you.
I also found it interesting that the Oura (like Whoop and others) tracks both resting heart rate and heart rate variability. Both of these correlate with how your body responds to stress, including training stress. When you’re well rested, you would expect to have a low resting heart rate and high heart rate variability. Here’s how those two metrics correlate for me:
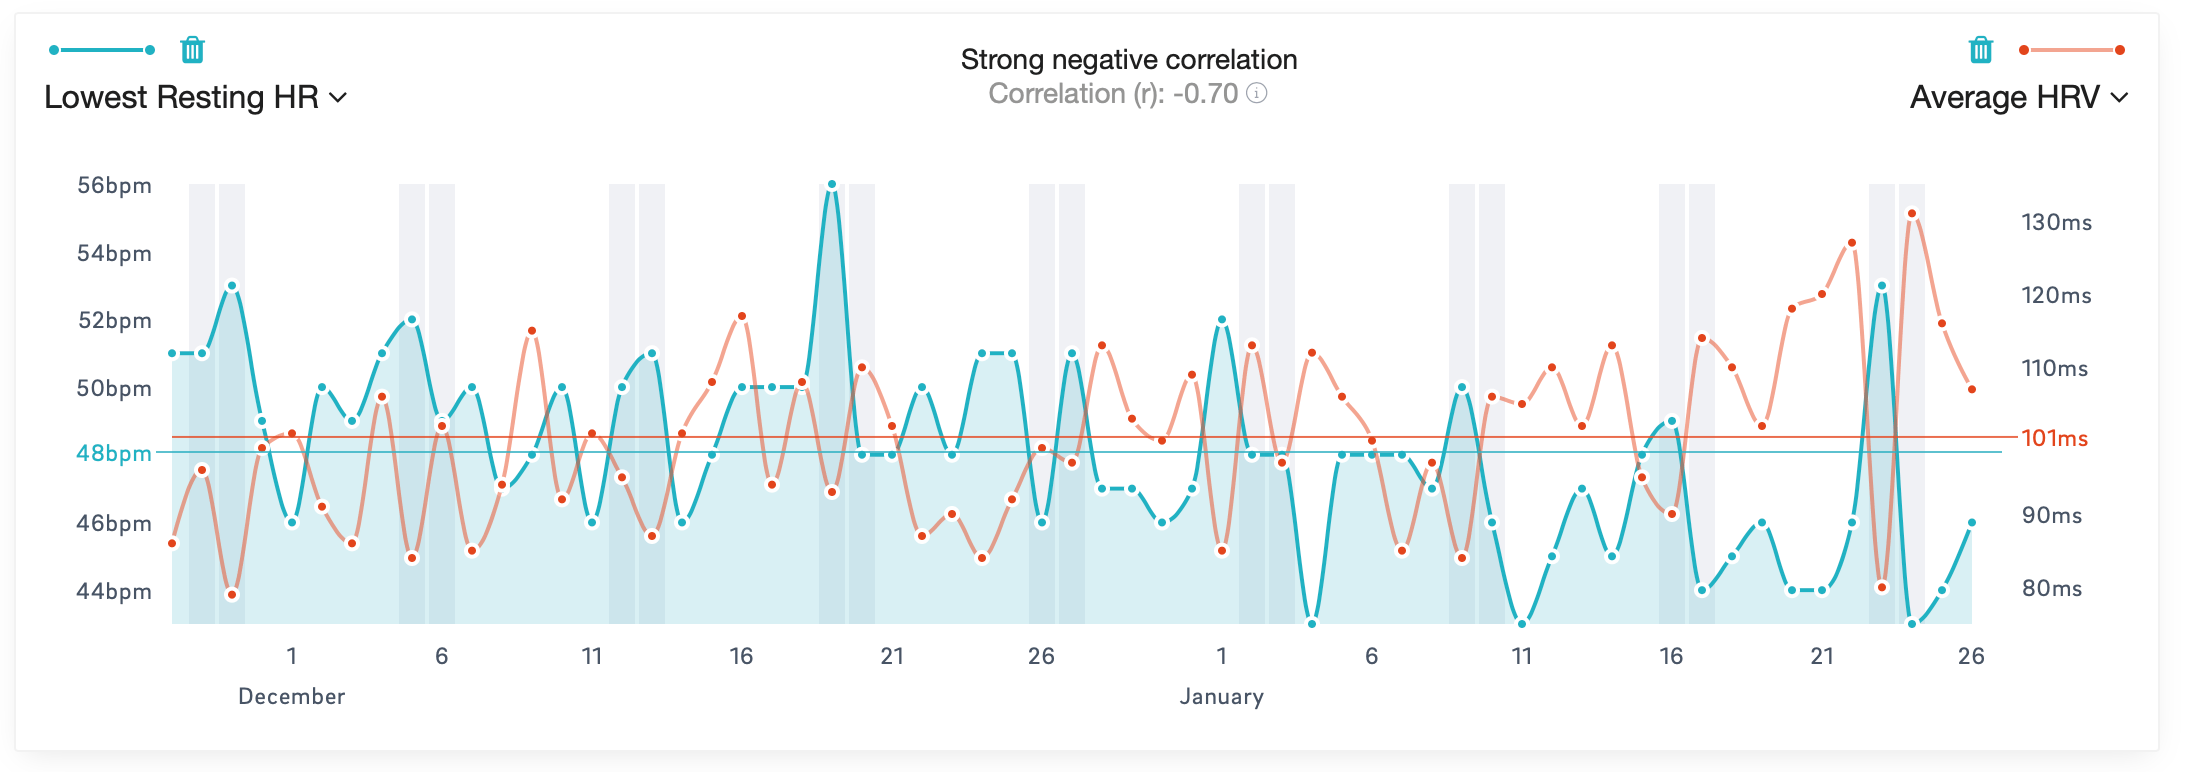
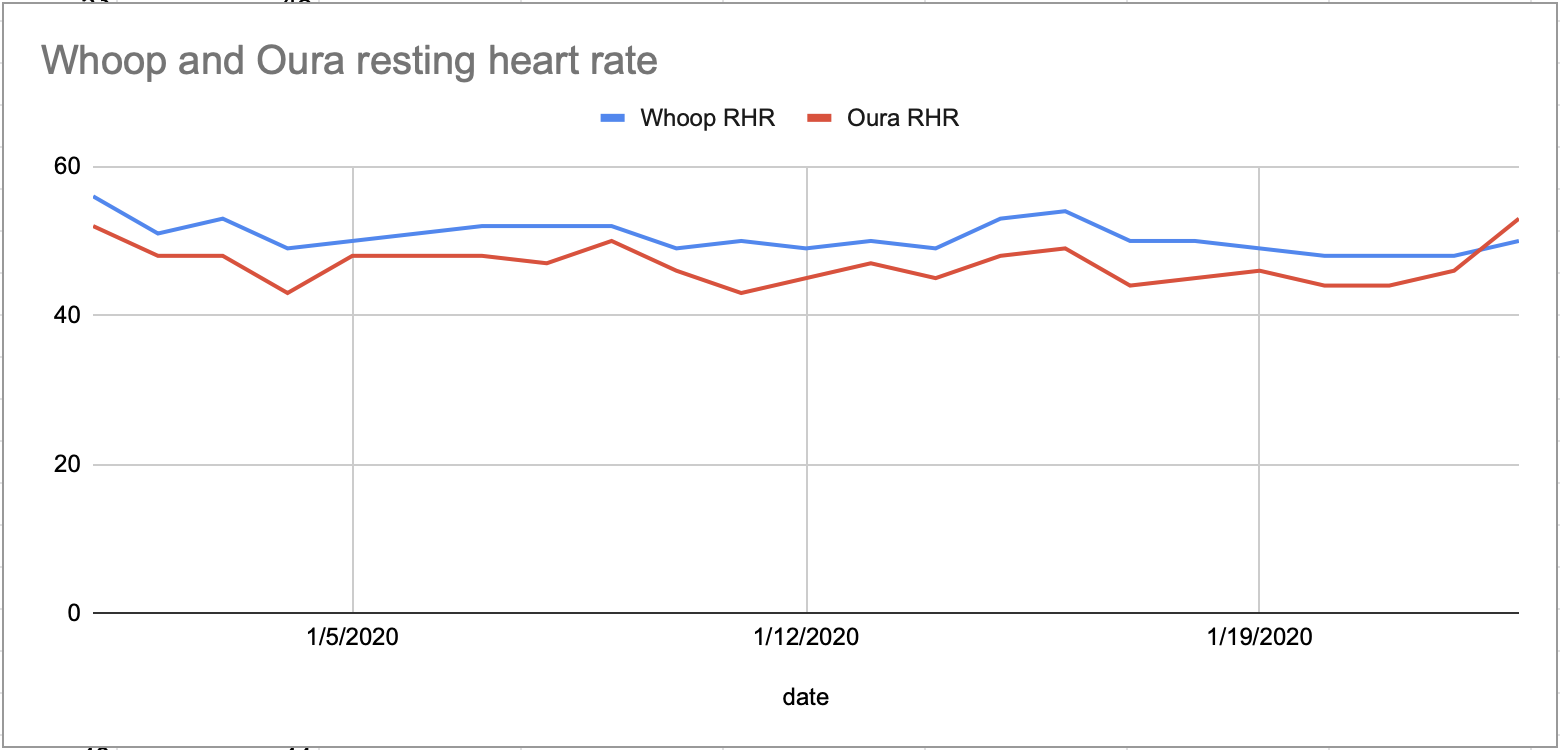
Now, could I get this information from a different source? Not as likely. On several nights, I wore my Apple Watch alongside the Oura. It, too, can measure resting heart rate during the night, but its numbers tended to be higher and it wasn’t as easy to pick out that weekly rhythm of work and rest days. I also compared Whoop and Oura on this measure (more about Whoop in the next instalment) and found they correlated pretty well, although Oura’s readings were usually a few beats lower than Whoop’s:
Looking at all the numbers the app gives you, you might start wondering how to optimise each of them. The r/ouraring reddit is full of posts in which people ask whether their HRV is “good” or not. But the whole idea here is to watch how your metrics change over time, not gauge what they are as an absolute. If your HRV is low for you, that can indicate you’re not recovered from some stress. If it’s low compared to other people in the world, that’s not necessarily useful information.
What I don’t do with this information
I still stand by the thought I had when I started this experiment, which is that I would never trust a gadget over what my own body is telling me.
In fact, I don’t even adjust my training based on how I feel unless I have a really good reason. That’s because how I feel on a given day is not as important as what I’m doing in the big picture. My coach likes to remind me that sometimes you are tired or your lifts feel hard because the program is challenging you. My guides for what to do on a given day are my goals and my body; a sleep score doesn’t enter into it.
So if Monday is squat day, I’m going to show up and I’m going to squat, no matter how tired or sluggish I feel. My score in an app isn’t going to change that. Experience has taught me that how you feel at the beginning of a workout doesn’t guarantee anything. I’m more likely to have a good workout or hit a personal record on a day I’m well rested, but I’ve also hit plenty of PRs on days on which I woke up feeling like crap.
Sleep scientist Amy Bender says she often advises athletes to take off their sleep tracker in the days leading up to a competition. It’s one less thing to overthink about.
What I actually do
I find the long-term trends most useful. I watch how my scores change over time, especially watching for that rest day bump. If my heart rate stays high and my readiness stays low, even after a rest day, that’s a clue that my schedule might not be allowing for enough recovery. I won’t skip a workout just because I got a bad score; rather, I’ll look forward and ask myself what’s the best way to plan my upcoming week or month.
Similarly, I use the scores as feedback on how well I’m handling my recovery. During the first few weeks of my high intensity training program, I went to bed early and slept late. My sleep and readiness scores were always good. But then I started staying up just a bit later. (I’m a night owl at heart.) And a helpful thing I learned is that my sleep scores were still good. I could have waited a week to see whether less time in bed meant more fatigue accumulating over time; instead, my scores gave me quicker feedback.
I also noticed two things that tended to keep my sleep score from hitting really high numbers. One I think is straight up wrong; more on that at the end of this piece. The other, restfulness, measures how much I move around during the night. I share my bed, so this tipped me off that sleeping alone might help me to sleep better. Sure enough, I tested this theory out and I really do get a better night’s sleep if I’m the only one in my bed. I can’t use this information on a daily basis — we only have so many beds in the house — but I’m filing this fact away for future reference.
The Oura app, to its great credit, strikes the right tone to let me learn from my data without bossing me around. I’ve tried a lot of different health-promoting apps in my lifetime, and almost every one of them has been pushy and judgmental. You’re doing it wrong is the subtext of every interaction. Or, if you’ve done something right, you’re momentarily in its good graces. Better not fuck this up, it seems to say.
But Oura’s messages are supportive. After you wear it for a while, the app will recommend a bedtime window in neutral phrasing. (“Your ideal bedtime is between 10:45 p.m.-11:45 p.m. Last night you went to bed at 11:42 p.m.”) I appreciate the recommendation, but I also appreciate that it’s an hour-long window rather than a strict cutoff. If I’m curious, I can tap the card to see a graph showing my bedtimes over the last few weeks. I’ve made it to bed in the window more often than not, which is good to know.
The messages that go along with your readiness and sleep scores each morning strike the same helpful tone. “We like to think about it as that we’re Alfred, and the user is Batman,” Oura’s CEO Harpreet Rai told me in an interview. “We believe users know their body. We’re just trying to provide a little bit of insight along the way.”
Here are a few examples of things the app has told me, alongside each day’s score:
- “You’ve had a nice amount of easy days in your workout routine lately. How do you feel, is it time to rev up?” (readiness score 85/optimal)
- “Your resting heart rate shows that you might not be fully recovered. To help recharge your energy levels, take it easy today.” (readiness score 64/pay attention)
- “Looks like you’ve gotten a nice amount of exercise over the past 7 days. A healthy balance between training and rest days helps build up your fitness and endurance, so keep it up!” (readiness score 87/optimal)
- “Seems like you didn’t sleep that well last night, and it’s taking a toll on your readiness. To get back on track, try to do something relaxing today and make sleep a priority tonight.” (readiness score 74/good)
I asked Rai how pro athletes use their Oura rings, and he gave a few examples. One is that some teams have altered their schedules — for example, staying the night after an away game rather than requiring players to miss sleep to travel. He’s also heard of coaches being more likely to check in with how their athletes are feeling or consider how fatigued they are when they’re able to discuss it in terms of the metrics they get from the app.
Ultimately, do you need the Oura, or really any tracker, to do these things? I’d argue that you don’t. You can take the same thoughtful approach to your sleep and training whether you have an app giving you daily scores or not. That said, I appreciate the level of detail I get from wearing the Oura ring. It’s not a must-have, but it’s a nice-to-have.
[referenced id=”753267″ url=”https://www.lifehacker.com.au/2016/10/what-sleep-tracking-apps-can-and-cant-tell-you/” thumb=”https://www.gizmodo.com.au/wp-content/uploads/sites/4/2016/10/14/myhi5orosyhnclyliv7c-300×180.jpg” title=”What Sleep Tracking Apps Can And Can’t Tell You” excerpt=”Activity trackers and sleep tracking apps will happily give you stats on your sleep: How many hours you were in the sack, for example, and whether that sleep was good “quality”. But you can’t take those numbers at face value, and some of them are flat out wrong.”]
One caveat
We told you years ago that sleep tracking gadgets are usually pretty good at detecting when you’re sleeping, but they don’t do very well at distinguishing the different stages of sleep from each other. In 2021, the technology has improved, and I’ve heard from many experts that Oura is considered the most accurate of the consumer sleep tracking devices. But that doesn’t mean it’s perfect.
There’s a good example of this in my REM sleep scores. I’d say I sleep well, since I usually feel well rested during the day, and my sleep score in the Oura app is usually pretty good. But one of the components of that score is how much REM sleep the app thinks I got, and my REM is always in the red. A normal amount of REM is 20-25% of your total sleep, which for me should work out to around an hour and a half to two hours. Mine averages about half an hour a night, with some nights clocking in at far less. I’ve seen 13 minutes, 11 minutes, even three minutes.
Amy Bender, the sleep scientist, reassured me when I mentioned this. “I guarantee you if we hooked you up to an EEG [electroencephalography] machine, you would have gotten more REM than that. I’ve scored probably a thousand sleep studies using EEG and I’ve never seen someone with three per cent REM.”
Oddly, when I added the Whoop band to my experiment, it told me I was getting an unusually high amount of REM sleep. Until that point I had wondered if I was a very weird and special human who can survive on very little REM, but now I’m pretty sure that the two apps just use different algorithms to guess when you’re in a given sleep stage. I will never again worry about my specific amount of REM sleep.
Leave a Reply
You must be logged in to post a comment.