
If you want to prioritise environmental friendliness with the next car you buy, a handy website called Carboncounter has done the hard work for you. With its interactive charts and graphs, you can see how more than 600 cars stack up in two key areas: greenhouse gas emissions and expected monthly charges.
The former is pretty easy to understand; it’s all older data based on a 2016 study, combined with data on newer cars that Carboncounter’s owners have manually added to site based on the study’s parameters. Nearly all 2021 models from all manufacturers should be in the website’s database, as well as 2020 models that haven’t been updated for the subsequent year.
As Carboncounter describes:
“Greenhouse gas emissions account for the entire lifecycle, including vehicle production and battery production, supply chains raw materials.”
The site’s average monthly cost of ownership considers three main factors: how much you’re spending on maintenance (ideally, no more than one or two big maintenance projects over the year, the costs for which the site splits across 12 months to calculate its figure) and gas, as well as depreciation and the actual cost of your car (both of which as also a monthly figure). The results are displayed in a graph like so, with monthly costs on the x-axis and greenhouse emissions on the y-axis:
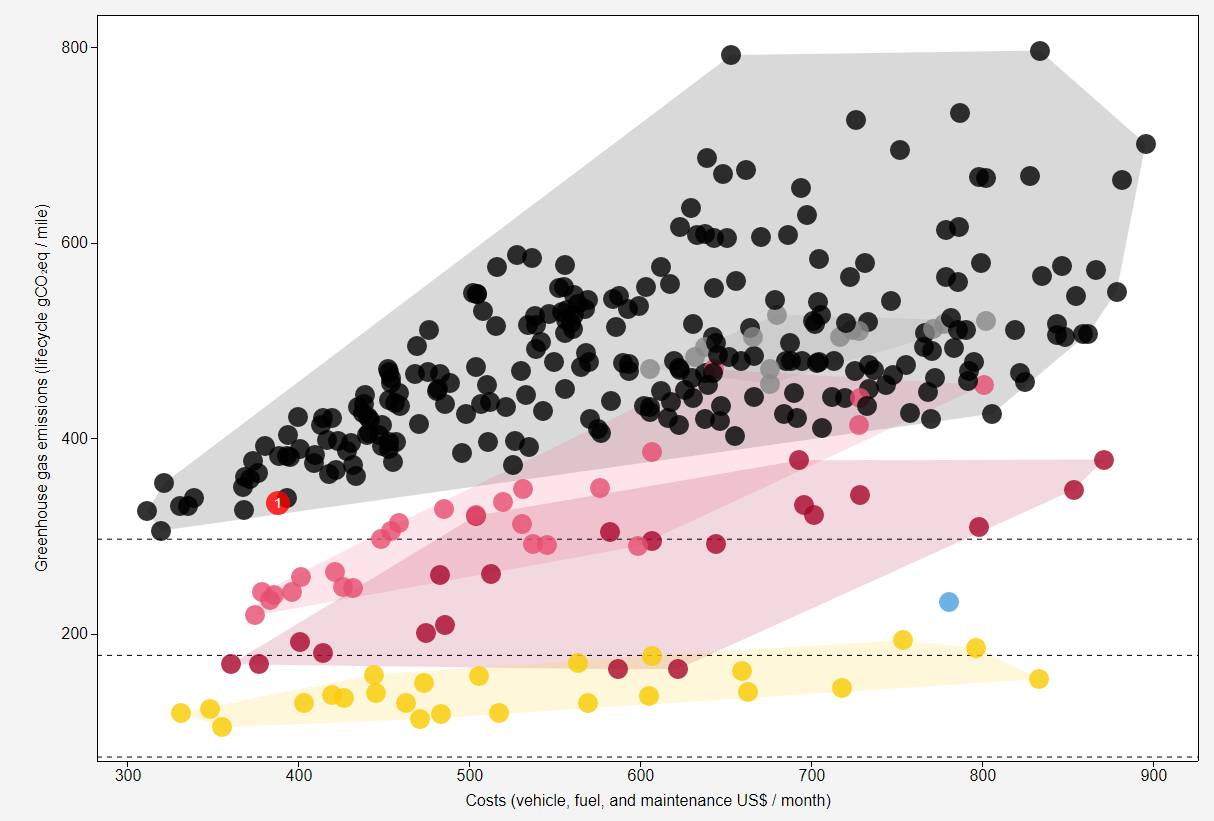
Those two little horizontal lines at the bottom of the chart represent 2030 and 2040 emissions targets (2030 on top; 2040 on bottom). Ideally, all new cars will be below the top mark within the next decade. While it might look disconcerting that so many cars are not, it’s only the start of 2021. That’s plenty of time for manufacturers to shift to more eco-friendly manufacturing and emissions — including a larger push for electric vehicles.
And if you don’t like how Carboncounter derives its statistics, or you’d like more customised stats for your specific state, you can dig right into the site’s formulas and make some modifications:
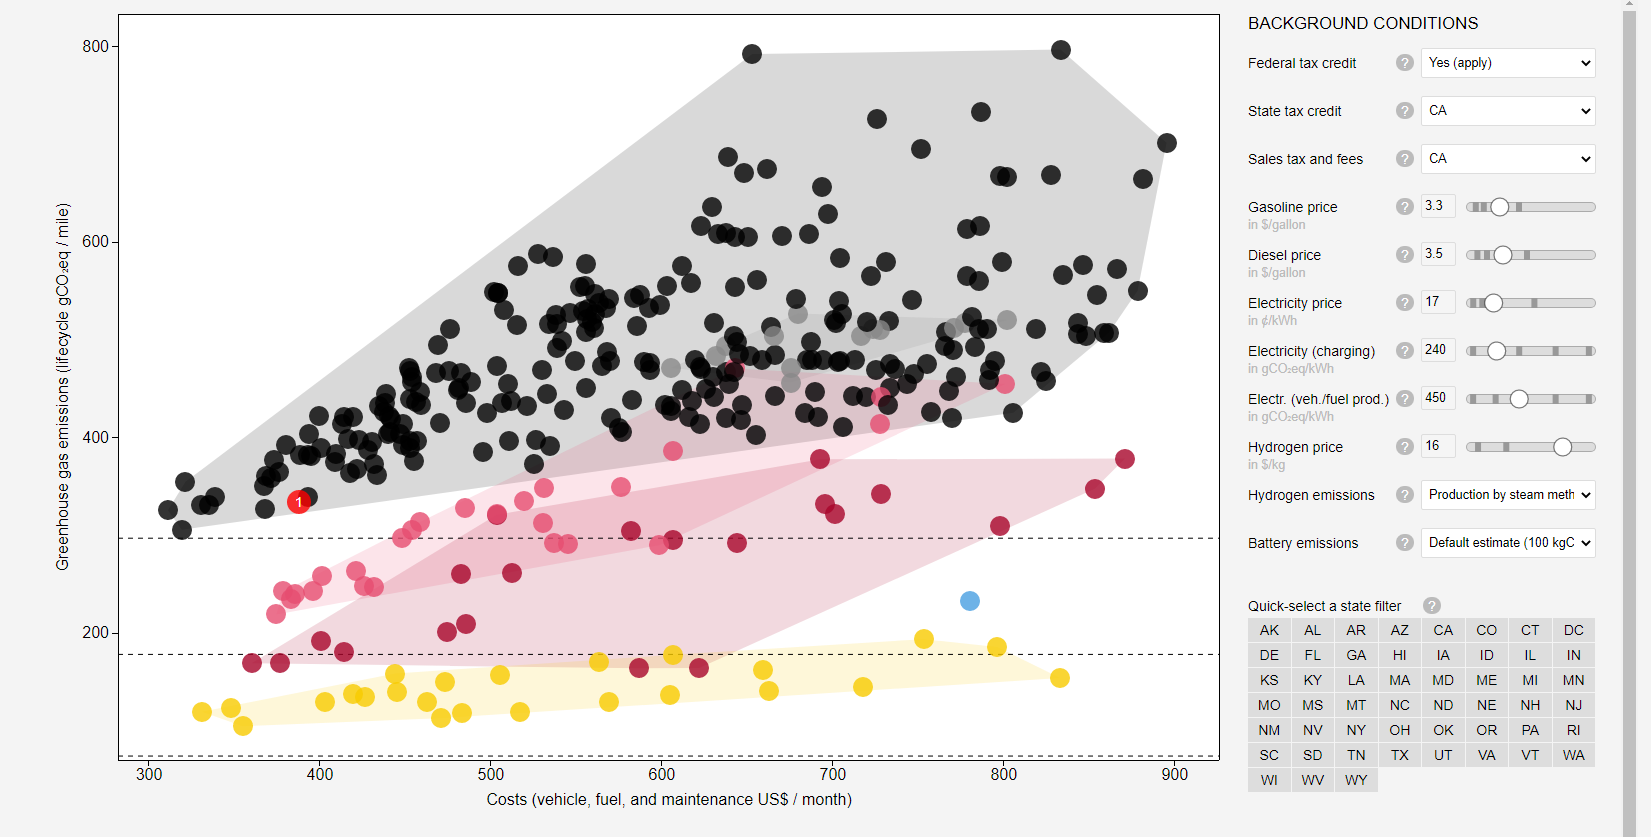
I found it useful to simply click the “select a state” filter to get more customised data for California — where everything is ten times more expensive than anywhere else, it seems. Below that are some handy sliders I could use to tweak my annual driving distance (currently non-existent, it feels like), how much I drive in cities versus highways (none / a lot), and how long I plan to keep my car until I sell it for a more accurate deprecation calculation, among other variables.
Carboncounter works best when you tweak its values for your personal driving setup. However, once you’ve done that, you’ll be able to see how the potential cars you’re eyeballing stack up. Use that to inform your next big purchase, or bookmark the site and come back to it when you’re ready to explore new makes and models. While you’re still within your rights to buy some over-the-top gas guzzler, hopefully this will at least get you thinking about the potential environmental ramifications (and costs) of your alternatives.
Leave a Reply
You must be logged in to post a comment.