Have you ever found yourself chugging coffee to stay up late studying, but then when it’s time for the exam, your mind is foggy with fatigue? Researchers from the US Army have developed an algorithm that can predict the energy peaks and valleys that come from drinking caffeine, and in turn, created a web-based tool that helps you predict how alert you can expect to be based on your own sleep schedule and coffee habits.
Image: Pixabay
The tool, called 2B-Alert, lets you enter a sleep schedule, as well as how much caffeine you drank and when. (You need to estimate the caffeine content yourself, but you can click Help to see a cheat sheet of how many milligrams of caffeine are in some common drinks and foods.) You can also import Excel data, if you happen to be tracking this already.
Once you click the Predict button, the graph will show a line indicating how alert you can expect to be over time, based on the sleep and caffeine schedule you entered. The graph can show up to seven schedules at once, so you could compare a sample week where you get regular sleep to a hectic week where you’re cutting back on sleep and trying to make up for it with an extra cup of coffee here and there.
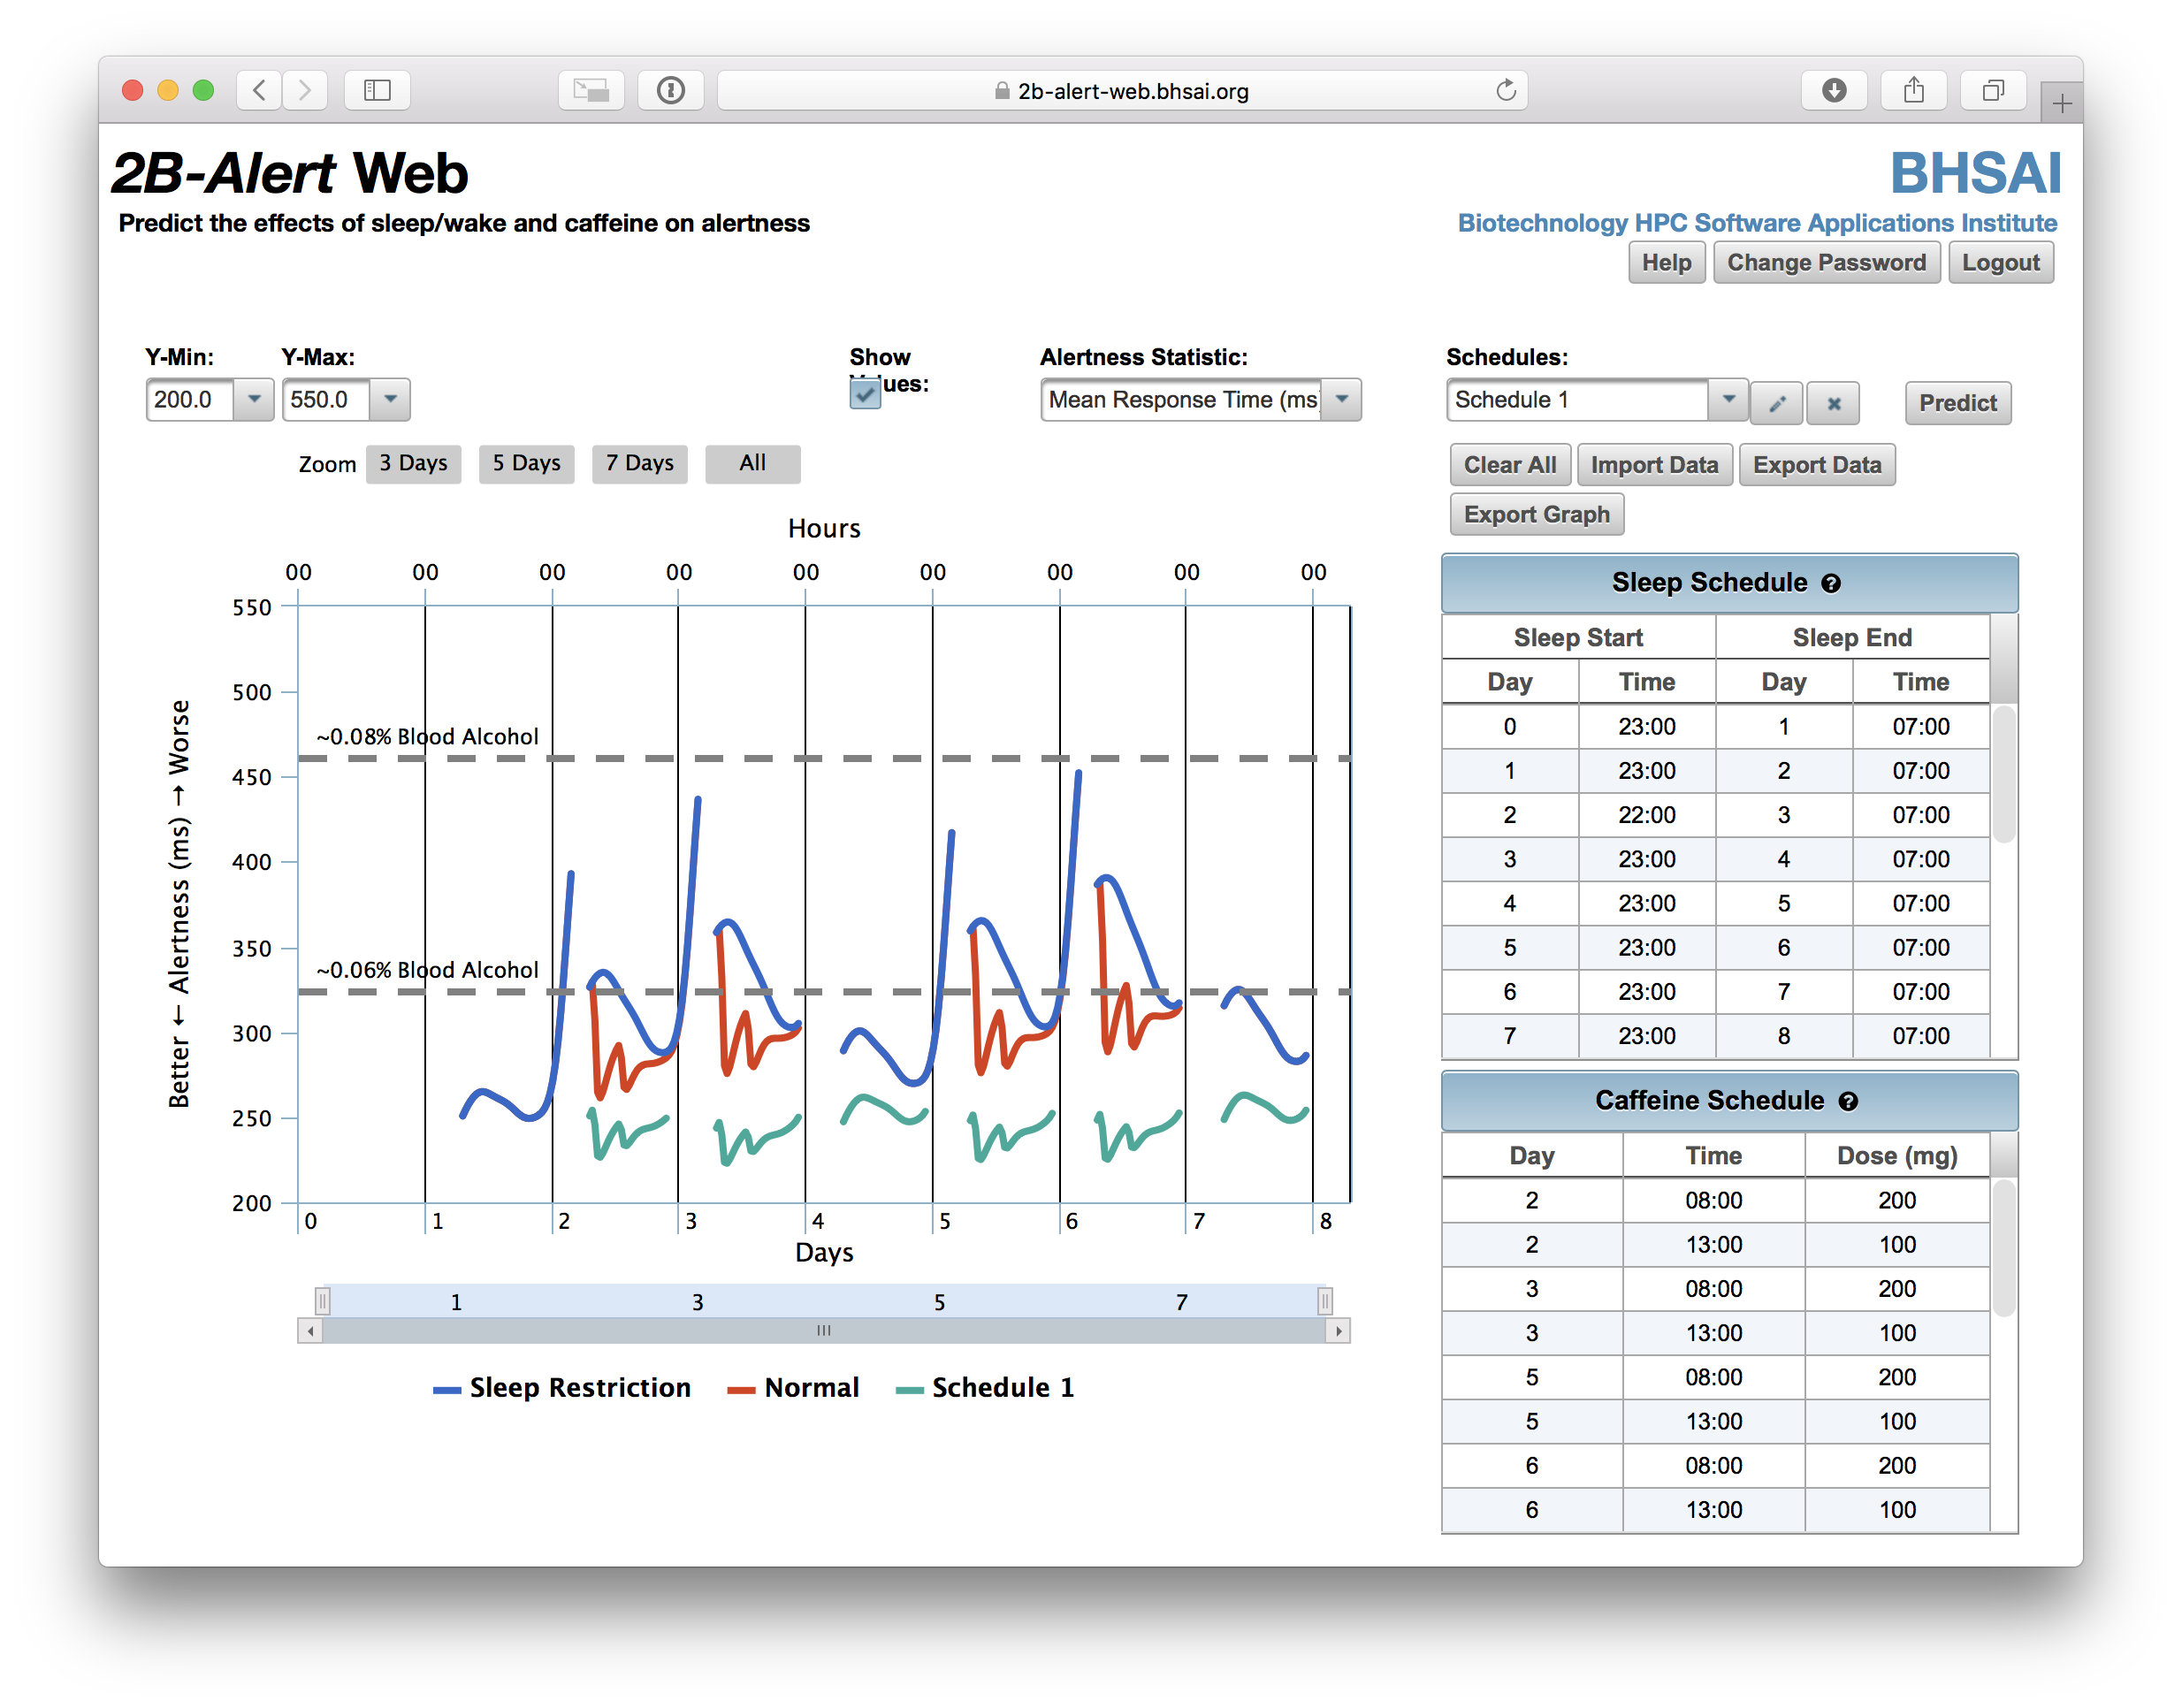
The blue lines show sleep deprivation without caffeine. Red lines show the same sleep schedule plus caffeine, and the green lines show the same levels of caffeine plus a lot more sleep. Screenshot: 2B-Alert
It isn’t the slickest design for a web app, but the data visualisation makes 2B-Alert fun to play around with. It’s especially interesting to see how sleep deprivation over many nights can have a cumulative effect, although that won’t surprise new parents.
The graph can also show how you can better time your coffee breaks to avoid an energy slump at an inconvenient time, such as on your drive home from work. Most strikingly, the graph has dotted lines overlaid to show the points at which fatigue can have the same affect on reaction time as being drunk.
The major drawback of 2B-Alert is that its algorithm is based on an “average” person. You can’t enter your height, weight or gender, for example. Since caffeine affects people differently, the graph might not be accurate to your own situation.
The researchers have also developed a smartphone app that learns over time how caffeine and sleep deprivation can affect you specifically, but that isn’t available to the public yet.
Luckily, other smartphone apps already help you track your caffeine intake and hopefully gain insight about how much to drink and when.
For iOS, you can try Caffeine App, which has a similar graph feature and can even notify you when your caffeine levels should be low enough for you to fall asleep. Caffiend, a more minimal iOS app, lets you track your caffeine intake as well as your hydration level, and makes entering drinks easy with three Quick Add spots to save your favourites. Both of those apps optionally sync your caffeine data to Apple Health.
On the Android side, try Caffeine Tracker: Kofe+, or, if you miss the graph, Caffeine Tracker.
[referenced url=”https://www.lifehacker.com.au/2018/04/how-to-make-japanese-style-iced-coffee/” thumb=”https://i.kinja-img.com/gawker-media/image/upload/t_ku-large/oq7nt6qqtin4ouwe5xh5.png” title=”How To Make Japanese Style Iced Coffee” excerpt=”Screenshot. Counter Culture Coffee Nothing livens up a hot afternoon quite like a cup of iced coffee. Trouble is, a lot of the iced coffee out there is just stale, leftover hot brewed coffee that’s been chilled, or cold brewed coffee with a much different taste. Enter Japanese iced coffee – the best of both worlds.”]
The 2B-Alert research was done by the Biotechnology High Performance Computing Software Applications Institute (BHSAI), part of the US Department of Defence, and the accompanying study was published May 28 in the Journal of Sleep Research.
The public tool doesn’t save your data or use it in the study – the schedules you enter and the resulting graphs are deleted when you log off, although you can export the data and graph yourself beforehand.
I’ve been staying up late writing all week, and when I entered my sleep and wake times, the graph showed that my regular coffee schedule of one cup in the morning and another at around 2PM wasn’t going to cut it. By moving my second cup to lunch and adding another at 3PM, I was able to stay alert through dinner. It’s also fun to see how an extra shot of espresso in my favourite latte (another 80mg of caffeine) affects the graph.
Comments