Even if you live in Windows, you may be surprised to find that it includes some rather powerful built-in tools to help you monitor your system and troubleshoot when things go wrong. We’ve taken a look at Windows’ dark corners before and at some awesome features you may have forgotten about. Here are a few more of our favourite overlooked Windows tools.
Photo by Lorelyn Medina (Shutterstock).
In this article, the details and instructions are based on Windows 8, but these tools are also available in previous versions of Windows, unless otherwise indicated.
System Information
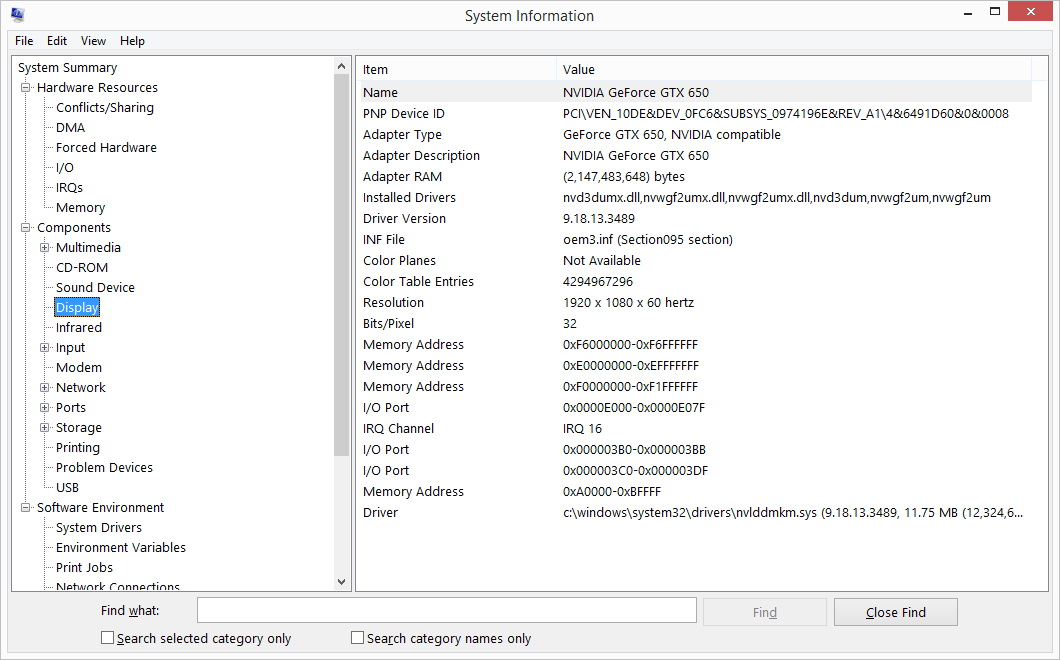
System Information shows detailed information about many aspects of your system, including hardware resources, driver and application details and Internet settings. You can find at Control Panel > Administrative Tools > System Information or just search for “system” on the Start menu.
Select what you want to see details about in the left pane and the details are shown in the right pane. While there’s a lot there to poke around in, you’ll probably find these are the most useful displays:
- System Summary. This view shows you basic information about the computer, such as the OS version, manufacturer and model of the computer, BIOS version, and amount of memory installed.
- Display. This view shows you what type of graphics card (or built-in graphics processor) the computer has, including the manufacturer, model and amount of memory.
- Network Adapter. This view shows you all of the network adaptors (wired and wireless) present on the system.
- Storage Drives. This view shows you all of the hard drives and optical drives on the system, their capacity, and how much free space they have.
You can’t change any settings using System Information, but it’s a handy tool for getting quick information about a system without installing any extra software. You can use it to print or save a report of the current system, which can be really useful if you like to keep reference files on computers you support for other people. You can also connect System Information to another computer on your network to view information about it.
That said, if you’re willing (or able) to install other utilities, there are some out there that provide a lot more information about your system and even some extra features. We’ve covered qyite a few, like Speccy and Hardware Freak.
Windows Memory Diagnostic
Memory problems are often hard to isolate. Faulty memory can cause everything from freezing applications to unsuccessful installations to full system crashing. And the most frustrating thing about them is that the problems often come and go. Windows Memory Diagnostic can help by running a full scan of the memory installed on your computer.
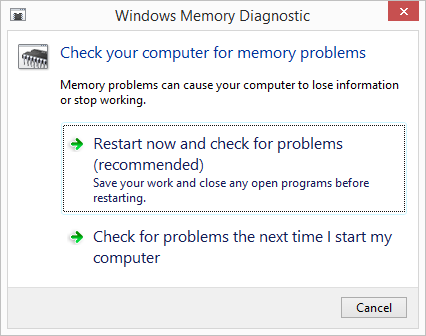
You can find Windows Memory Diagnostic at Control Panel > Administrative Tools or just by searching “windows memory” at the Start menu. Unfortunately, Windows has to reboot in order to run this tool since it needs to run before Windows is actually loaded on the system. You have the option of rebooting and scanning immediately or scheduling a scan during the next reboot. If you want to go ahead and run the scan, make sure you’ve saved and closed out of all your programs before running it.
As your computer restarts, Windows Memory Diagnostics will take over and run the scan. When it’s done, Windows will start and you’ll see a message about how the scan went. If you want a little more control, press F1 when the tool starts. You can adjust elements like what level test you want to run (those levels are described in the tool) and how many passes the tool should make.
Event Viewer
Windows records events in several different logs, and it logs a lot of events. Depending on how your system is configured, it logs everything from informational events (when a service starts up OK) to cautions and errors (when a program crashes or a service can’t start) to security events such as unsuccessful log on attempts.
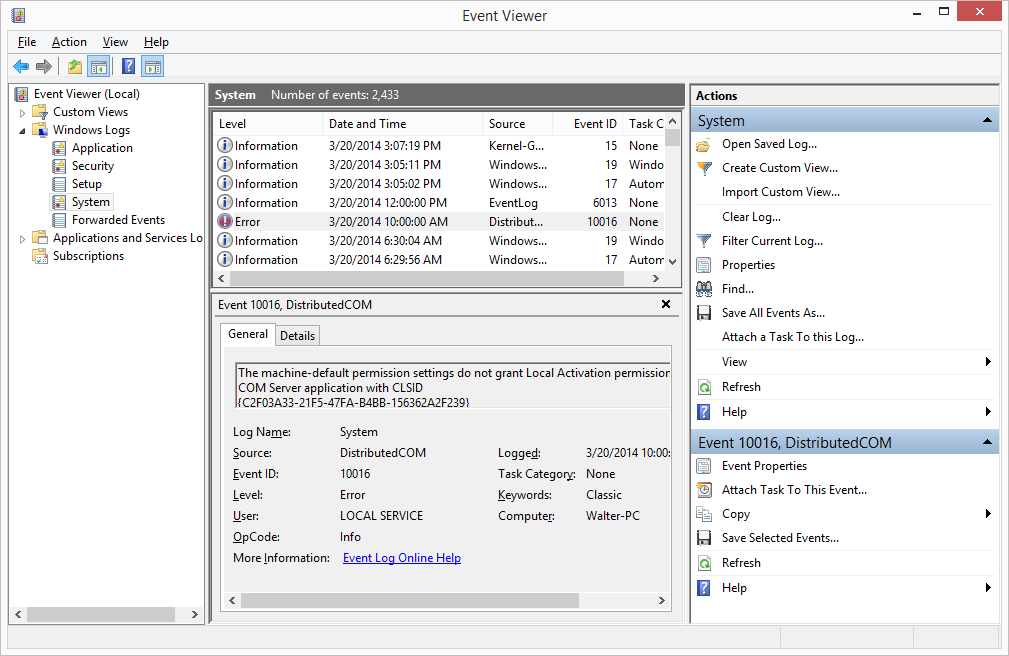
You’ll find Event Viewer at Control Panel > Administrative Tools or just search for “event” on the Start menu. There’s a lot to Event Viewer, but as a regular user, the things that might be of use to you are all under the Windows Logs folder. In particular, these three logs can be helpful:
- Application. The Application log is a record of events generated by applications. All Windows services write their status information to this log. This is the most valuable log for monitoring the general health of a computer.
- System. The System log is a record of events that concern components of the system itself, including such events as device driver and network failures. This is the most valuable log for finding information on specific errors.
- Security. The Security log is a record of events based on any auditing settings you or your company have configured. Unless you suspect somebody is trying to gain access to your computer, this one is going to be less useful than the others.
Now, before we go any further, you should note that you are likely to see a number of cautions and errors pop up in these logs and many of them aren’t important at all. Often, a service will fail to start, log an error, and then Windows will start the service successfully when it tries again. If you see an error you’re concerned about, check the events following the error to see whether it resolved on its own.
But really, Event Viewer is less about monitoring the health of the computer and more about tracking down problems. If you feel like something strange is going on, like apps crashing or things not starting up as they should, check out Event Viewer for events that may be related.
If you find some errors that you’d like to know more about, note the Event ID and search for information about it. You can almost always find something useful at the Microsoft Knowledge Base when you search using the keywords “event ID” plus the actual ID number.
Performance Monitor
Windows has several tools for monitoring performance. For a quick look at resource use, you can just fire up Windows Task Manager and for a more detailed look, Windows Resource Manager. But Performance Monitor is the king when it comes to isolating performance issues in Windows.
Performance Monitor measures the statistical data generated by various components of your computer. It breaks that data down into three distinct pieces.
- Objects. An object represents a major system resource that is either physical or logical in nature. Examples of physical objects are physical disks, processors and memory. An example of a logical object is TCP, which represents one of the major networking protocols of the TCP/IP suite.
- Instances. A separate instance of an object exists for every component of the type the object represents on your computer. For example, if you have three hard disks attached to your computer, there would be three instances of the physical disk object.
- Counters. Each instance of an object is further broken down into counters, which are the actual aspects of the object that you can measured. For example, the physical disk object includes a number of counters such as %Disk Time, %Idle Time and Average Disk Bytes per Read.
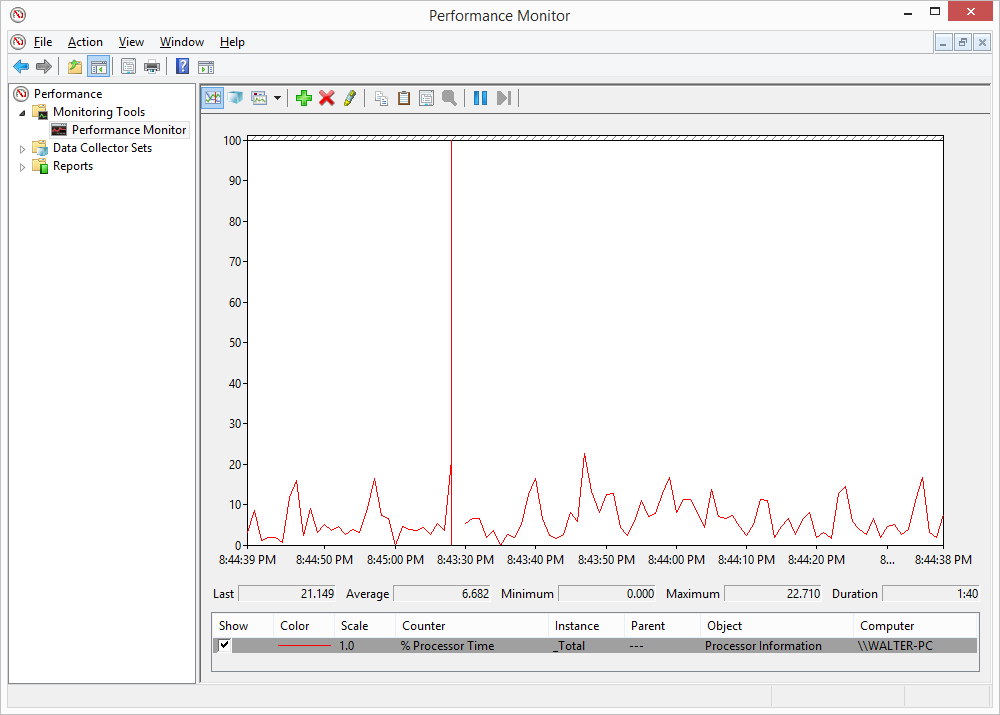
You can open Performance Monitor at Control Panel > Administrative Tools > Performance Monitor or by searching for “performance” at the Start menu. When you first open Performance Monitor, it starts measuring a single counter for you by default: %Processor Time.
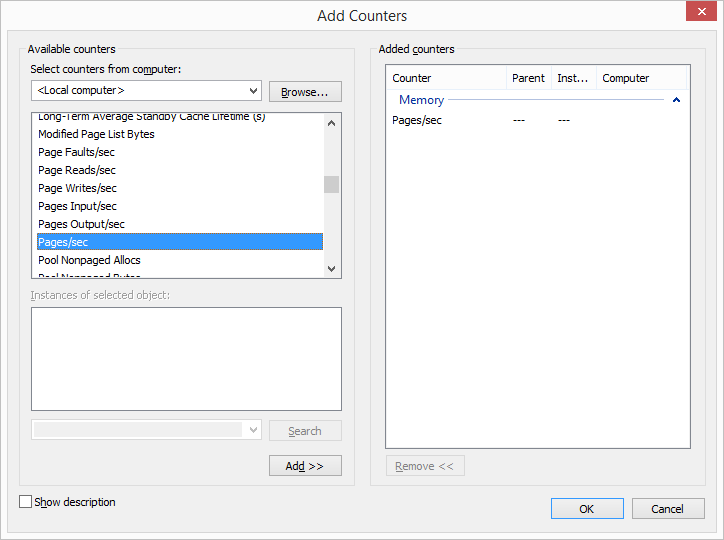
You can add counters by clicking the Add Counter button (it looks like a plus) and browsing through the available counters. There are a lot of them, so don’t be intimidated. For a quick look at basic performance, try measuring these three counters:
- Pages/sec. Part of the Memory object, this counter represents the rate at which pages are read from or written to disk during virtual memory operations. Consistently high values can indicate that not enough memory is present on a system.
- Avg. Disk Queue Length. Part of the Physical Disk object, this represents the average number of read and write requests queued for the selected disk. Consistent values above zero means requests are backing up, which may indicate not enough memory or a slow disk system.
- %Processor Time. Part of the Processor object, this represents the percentage of elapsed time that the processor spends executing non-idle tasks. Consistently high values (over around 80%) may indicate that your processor is bottlenecking your system.
The real power of Performance Monitor (aside from the sheer number of things you can measure) is that you can monitor and log performance over time by leaving the System Monitor running in the background. It doesn’t consume a lot of resources on its own, so you can leave it running for the day while you go about your business and then come back later to check things out. If you want to know more about what you can do with Performance Monitor, read up on it over at Microsoft TechNet.
Shared Folders
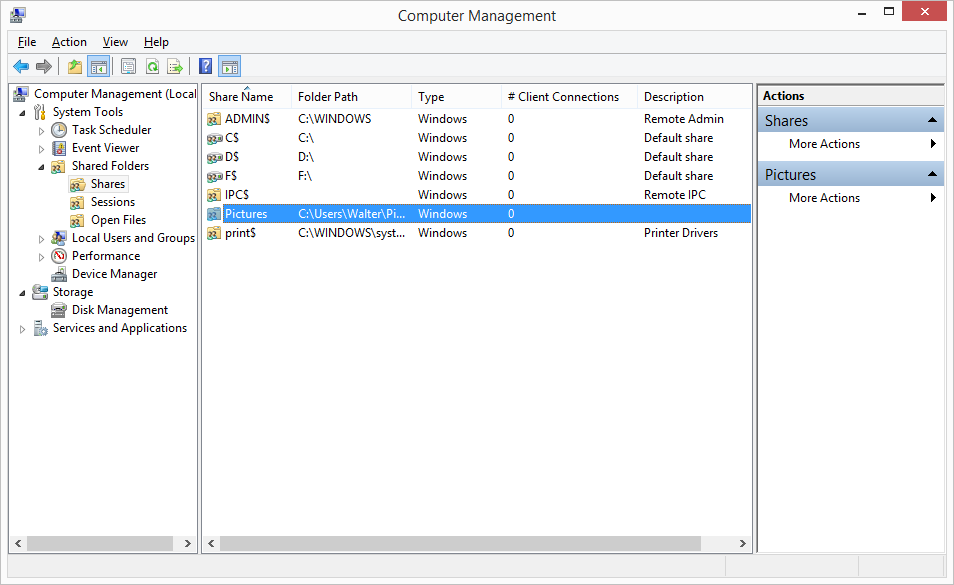
The Shared Folders tool provides a central place for viewing all of the shared folders in Windows and for managing those folders. You can use it to share or stop sharing a folder, disconnect a user that’s connected to a share, set permissions for a share, and more.
Under Shared Folders, you’ll see three items you can work with:
- Shares. This view shows all of the folders shared on your computer. If you see a dollar sign ($) after the name of the share, that means it’s a folder automatically shared by Windows and accessible only by administrative accounts. If you don’t see that dollar sign, it’s a folder you shared. Right-click a folder to see actions you can take, like stopping the share or configuring advanced properties like connection limits and specific permissions.
- Sessions. This view shows all user sessions currently connected to your computer. If someone on the network is accessing a folder you’ve shared, you’ll see it here. Right-click a session to find commands for disconnecting that session or disconnecting all currently-connected sessions. Just be mindful when disconnecting people. They may actually be in the process of working with a file on your system.
- Open Files. This view shows all files that are open on the system by a remote user. Right-click an open file and you’ll see a command for closing it.
A final couple of notes about these built-in tools. Some are powerful; some are more basic. You can often find third-party tools that suit your needs better. But it helps knowing what tools you already have access to, especially if you’re working on someone else’s computer and may not want to (or be able to) install additional software. Also, many of these tools (like Performance Monitor, Shared Folders, System Information, and Event Viewer) allow you to connect to other Windows computers on your local network, providing an easy way to gather information and troubleshoot remotely.
Comments
7 responses to “Five Powerful, Built-In Windows Tools You Might Not Know About”
+1 for awareness of Event Viewer. When you get a phone call from an Indian guy who works for “Windows”, the first thing they’ll do is get you to press a bunch of buttons and open up the Event Viewer, where they’ll tell you all those errors you see are viruses and you’ll need to pay $100 to get rid of them.
Educate yourselves so you can have a giggle and hang up, knowing what they’re up to!
Or better yet play a dumb ass and say your doing things but it’s not working. The more time you take of theirs, the more it costs them and saves them targeting someone that they could potentially scam.
Also it’s really funny getting them annoyed at how “dumb” you are. I’ve had a co-worker record a session with them and they hard raged calling them not nice things.
Have a VM set up with a snapshot. Let them make the connection to your virtual machine, screw it up (one tactic they use is turning off Windows from starting up in MSConfig) and restart it. Load up the fresh snapshot.
“My computer is still fine”. They will be so confused.
Also, look up Windows 7 God Mode. Just discovered that one lately.
Oh man, you could go a step further.
Have 2 virtual machines, let them work on one, say running Windows 7, and then when they shut it down, switch it to another one running Windows 8, and then when it boots back up ask them what the hell they’ve done.
Haha! That’s gold!
I did that late last year. I (finally, had been hoping for a while) got a call from them. It was a quiet weekend with nothing on, so I humoured them.
Got my Android tablet and followed along, I knew what they were asking me to open, so I pretended I had opened it and things went along nicely. Spent 45 minutes on the phone with them, telling them I couldn’t open LogMeIn Rescue, TeamViewer and other “support” apps they wanted me to open. We tried fixing file associations with registry keys, everything under the sun. The whole time I was just sitting there checking Facebook and stuff
I could tell they were reading from a script and Googling when absolutely necessary, because I was dropping very obvious clues that I was on an Android tablet (even saying at one point “Umm, I’m using Windows Android on an iPad, is that a problem?”) and they’d just say “Yes, yes sir, can you please click on the start menu again?” trying to get things back on track.
In the end I told them I worked in IT and knew what they were doing. They hung up, then called back and told me they had different instructions for me, because they thought I was using Windows 8. I repeated that I worked in IT, and they didn’t call back for many, many months.
FU for being racist! And are you thinking that it’s not working on you? it is, otherwise the so called Indian guy would not be calling you!
He wasn’t being racist, he was simply making a statement based on his experience and I would have to say it seems to me that EVERY one of these calls I get is from an Indian as well.
…but they still called you back?