
Despite slight improvements to our fixed broadband speeds, Australia remains well outside the top 50 when it comes to fast internet. We are currently ranked 58th on the Speedtest Global Index with average download speeds of 41.31 Mbps – a huge 25.21mbps below the global average. So what went wrong?
It’s hard to get an accurate picture on the balance of NBN technologies that are already in place in Australia. To get around this opacity, we used the “check your address“ tool on the NBN website as a way to collect data on the footprints of technologies currently or about to be in place in three Australian metropolitan cities of Sydney, Melbourne and Brisbane.
Note: If you want the fastest internet speed that are currently available, your best bet is to sign up to an NBN 100 plan. While these plans won’t get you anywhere near 1Gbps, they should provide enough speed for intensive workloads and Ultra HD video streaming. Here’s a look at how ISPs price their unlimited NBN 100 plans. (Click on the table for more info on each plan.)
The data suggests around half (40-60%) of homes in the three cities only have access to very old technology: hybrid fibre-coaxial (HFC). For people in these residences, access to the so-called “fibre network” remains only a fairy tale.
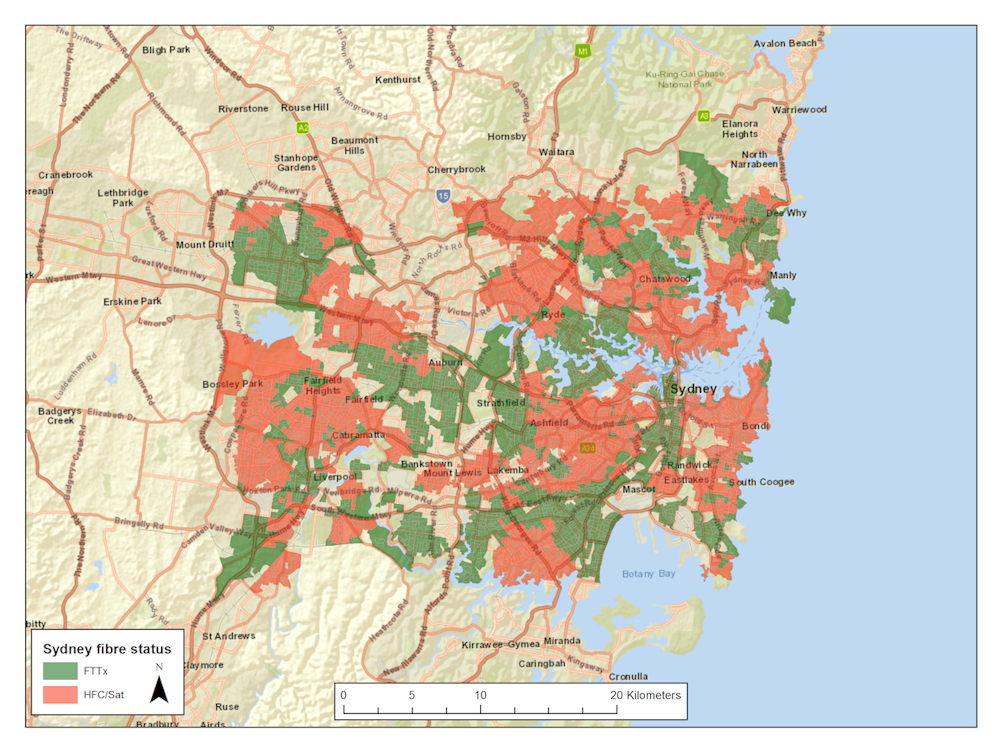
Around 55% of homes have old NBN technology in Sydney. Green areas represents addresses with fibre technology (FTTX) and red areas represent addresses with older hybrid fibre-coaxial/satellite NBN (HFC/Sat).
Tooran Alizadeh, Author provided
Real data on the NBN
Lack of data transparency is a vexing aspect of the NBN. In our experience, NBN Co does not disclose meaningful information on service footprints in a single, usable dataset. This makes it difficult to evaluate outcomes and perform policy analysis associated with the service.
Nevertheless, our latest research has collected some data we believe was undisclosed previously.
Over December 2018 to February 2019, we used the “check your address“ search function on the NBN Co website along with basic data mining techniques to extract data from a representative sample of all addresses across the three metropolitan regions of Sydney, Melbourne, and Brisbane.
We uncovered footprints of mixed-technology NBN, including current or planned fibre to the premises (FTTP), fibre to the node (FTTN), fibre to the building (FTTB), fibre to the curb (FTTC), hybrid fibre-coaxial (HFC), fixed wireless and satellite (Sky Muster).
Here we mainly focus on hybrid fibre-coaxial (HFC), which is the oldest technology component of the NBN. HFC is the cable network you might have connected to in the past to get Foxtel subscription TV.
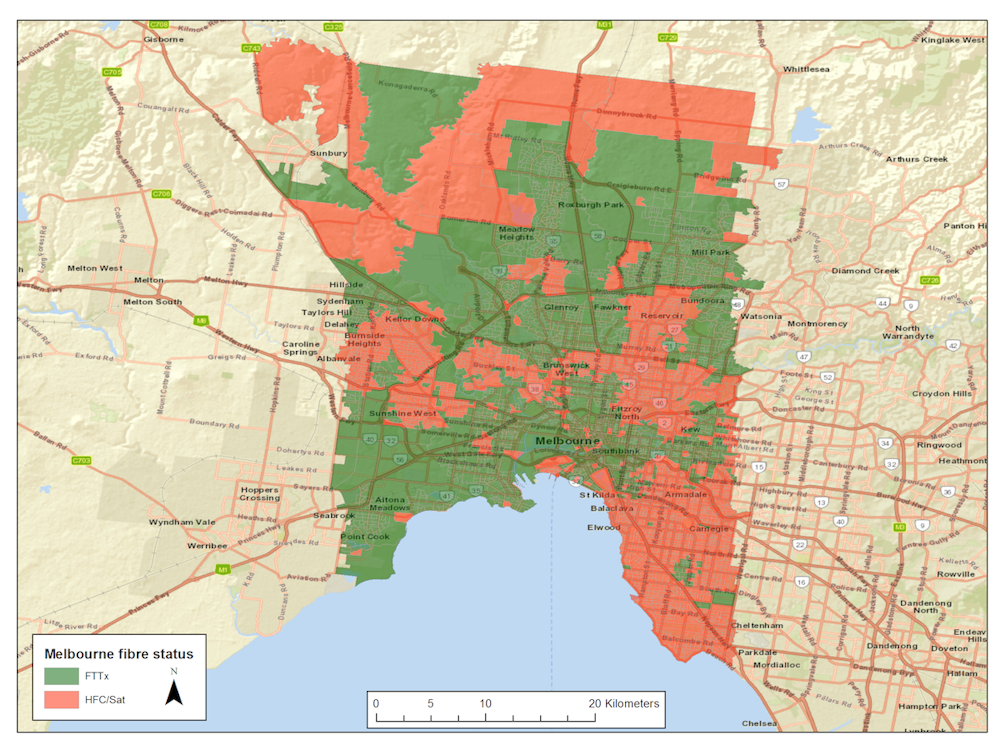
Around 42% of homes have old NBN technology in Melbourne. Green areas represents addresses with fibre technology (FTTX) and red areas represent addresses with older hybrid fibre-coaxial/satellite NBN (HFC/Sat).
Tooran Alizadeh, Author provided
Major cities rely on HFC
The three maps shown here represent the spatial presence of fibre infrastructure versus more inferior HFC/satellite NBN in three metropolitan regions of Sydney, Melbourne and Brisbane (In reality very few urban homes use satellite, as shown in bar graphs below).
The three maps suggest inferior NBN technology is in abundant use across all three metropolitan cities. 62% of all addresses in the greater Brisbane region, 42% of all addresses in Melbourne, and 55% of all addresses in Sydney are (or will soon be) connected to the NBN via HFC.
These figures are at odds with a recent claim by Minister for Communications Mitch Fifield that his government is rolling out “a new network“ to the whole nation. For about half of the addresses in three major Australian metropolitan regions, the NBN “rollout” looks like a re-branding exercise using an old cable network.
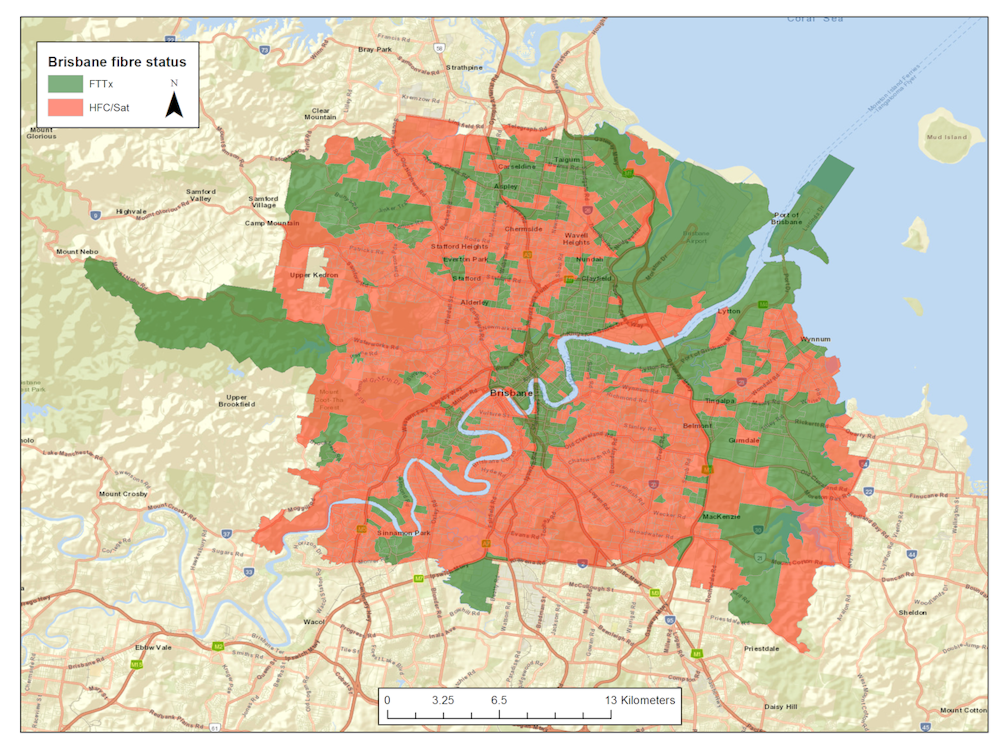
Around 62% of homes have old NBN technology in Brisbane. Green areas represents addresses with fibre technology (FTTX) and red areas represent addresses with older hybrid fibre-coaxial/satellite NBN (HFC/Sat).
Tooran Alizadeh, Author provided
Socioeconomic patterns of the NBN
To look at socioeconomic patterns of the NBN rollout, we used the Australian Bureau of Statistics’ (ABS) socio-economic indexes for area (SEIFA) and its index of Relative Socio-economic Advantage and Disadvantage (IRSAD) from 2016. We then cross examined the SEIFA data (divided into ten ranked groups known as “deciles”) with the NBN data extracted via the data mining exercise (described above).
It’s clear in the graphs below that a mix of both old and new technologies are in play across the three metropolitan regions of Sydney, Melbourne and Brisbane.
The analysis did not find any clear socioeconomic patterns comparing better-off SEIFA deciles of 8-10 versus worse-off deciles of 1-3. Nevertheless, the size of HFC adoption across the socioeconomic spectrum in all three major cities is quite concerning.
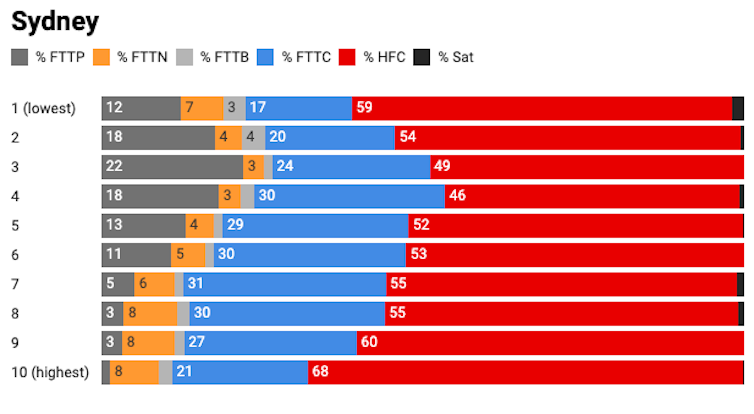
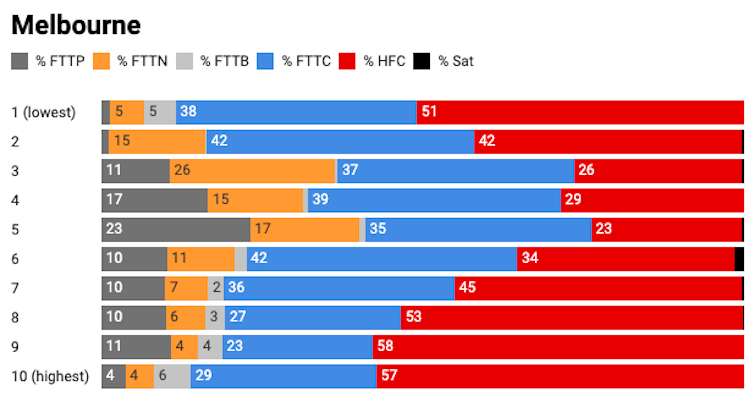
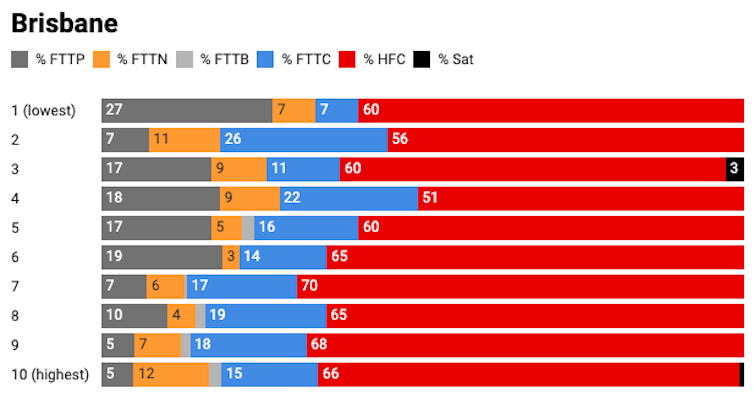
Availabilities of different technologies across different socioeconomic deciles (1 = lowest socioeconomic status, 10 = highest) in Sydney, Melbourne and Brisbane. NBN technologies are FTTP (fibre to the premises), FTTN (fibre to the node), FTTB (fibre to the building), FTTC (fibre to the curb) and the older HFC (hybrid fibre-coaxial) and Sat (satellite).
The second most dominant technology in the three major cities is fibre to the curb (FTTC). This is a technology that was only added to the mix 12 months ago, as a partial solution in response to the mounting issues related to the HFC network.
If it was not for this late addition to the network, the NBN footprint may have had an even higher dominance of old HFC technology than currently. It’s also clear that the rate of FTTC adoption in greater Brisbane is well below that in Melbourne and Sydney.
An NBN upgrade is inevitable
Since the announcement of mixed-technology NBN, experts have warned against the serious shortcomings of the old HFC technology.
While these were mostly ignored initially, Bill Morrow (then CEO at NBN) later admitted that NBN speed was slowed by reliance on copper network. Supporting this, an analysis by the Australian Communications and Media Authority (ACMA) revealed that the average household on the HFC network was reporting between 2 to 3.6 times more faults than those on fibre, and making between 3 and 5 times more complaints.
It’s also been reported that about 40% of the NBN is fibre to the node (FTTN) which has its own fair share of issues.
Interestingly, there have already been some partial upgrades within NBN Co’s plans, as FTTC reportedly accounts for about 12% of the national network, to serve the areas that were previously assigned to receive HFC.
We argue that for Australia and Australian major cities to be competitive on the global platform, an NBN update is inevitable.

Tooran Alizadeh, Senior Lecturer in Urbanism, Sydney Research Accelerator (SOAR) Fellow, University of Sydney; Edward Helderop, Postdoctoral researcher, Arizona State University, and Tony Grubesic, Professor, Arizona State University
This article is republished from The Conversation under a Creative Commons license.
This story has been updated since its original publication.
Comments
17 responses to “So Just How Borked Is The NBN?”
“due to “six years of vandalism” by the Coalition government”
Not wrong, that’s for damn sure. Boy was I pissed when they started screwing it up, like those incompetent backward imbeciles do with everything.
“We are absolutely confident 25 megs is going to be enough — more than enough — for the average household” – PM Tony Abbott.
Sounds like things have proceeded according to the Government’s plans.
Just remember who was responsible for this when you vote on May 18.
Yes, Labor’s crazy literal back of a serviette plan from Conroy to lock in his stupid internet filter has cost this country a fortune and made us taxpayers pay for technology that is already superceded.
Do tell what technology supersedes optical fibre.
Betting $100 this dude falsely proclaims 5G is a viable replacement for Optical fibre.
Oh no…someone with an edumacation! A couple of things to note.
1. The Internet filter was universally backed by the 2 major parties. It was a bipartisan piece of legislation fought only by the greens and other minor parties/independents.
2. If you’re talking about fibre being a superseded technology, you would be grossly mistaken. Superseded by what, 5G? What do you think the back haul for 5G is? That’s right, fibre. 5G will be available in localised pockets in metro areas, but as with 4G the more people that use it the slower it will get. Fibre on the other hand will suite us for the next 100 years easily without breaking a sweat. On top of that the upgrade process is basic. The cost of a FTTP roll out was not the technology, it was buying the rights from Telstra to lay the cable and trenching for new cables.
In an airline lounge in San Francisco last week: 178Mbps down, 139Mbps up. Back home to my 50/20 NBN plan and I am getting at best 37/17. For a few days after getting home I was getting rubbish like 1.5/13 with frequent total dropouts.
Lucky duck, I get 10/0.3 on good days.
This is literally unacceptable especially from a business standpoint. Uploading videos is impossible, making the entire streamer business impossible for Aussies.
Even basic things like uploading files to the cloud take stupidly long times
Corporate greed and Government incompetance with just a hint of political greed.
*Politicians: “Oops we kicked the political NBN football onto the roof… Oh well, lunch time!”
Looking at the Brisbane map, it doesn’t look like the research takes into account all of Brisbane.
I live in BCC with FTTN connection and my suburb is not included in the map.
Also Logan and Redland shires don’t seem to be included. That’s probably why the FTTN %is so low.
So not sure their data mining excercise is representative of reality.
When there’s a council cleanup in my area, the scavengers drive around with trucks and make any traces of copper disappear in minutes. … Just a thought.
To give you another source of information for what technology types are used in what areas, there are sites such as this http://nbnmtm.australiaeast.cloudapp.azure.com/
It seems accurate at-least for the suburbs that I work and live in
Utterly B0rked.
I only just got FTTN enabled a week ago.
I went from barely ADSL1+ speeds to Barely ADSL2+ speeds. I was paying for the top speeds and downloads as I want/need that.
The only upside is that I got a minor upgrade in speed and download limit for a cheaper price (adsl1+ was costing me $100 a month. now i pay $80 a month for the ADSL2+ speeds of FTTN).
thats if I forget about the BILLIONS its cost us as tax payers..
“due to “six years of vandalism” by the Coalition government”
indeed. I will *never* forgive the Libs and Nats for this. Not for as long as I can vote.
You voted for the Liberals three times in a row.
There’s your answer.
I grow increasingly frustrated over time with the situation that was blatantly going to occur. And now it has.
Thanks Libs for the awful 25/10 downstream and upstream speeds that I personally get (on a 100/40 plan, which I don’t have to pay a premium for at least since it doesn’t meet the speeds) with a FTTN cabinet ~30m away from my house across the street (I’m number 4 on the street, FTTN cabinet is in front of number 3). Bloody ridiculous.
There’s no solution to increase my speeds apparently besides paying over $3000 to $10,000 to switch to FTTP.
Hope has been abandoned after 3 years of everybody being perfectly aware of how horribly Liberals had messed this (and many other things up), and yet, the majority of us voted them in again. When you recompense bad behaviour the only thing that can be expected is for them to explore what else can they still get away with.