If you have a hard time differentiating your pop Christmas tunes from you shimmer psych jams, you’re in luck. This scatter graph will help you get a grip on pretty much any genre of music, including some you’ve likely never heard of.
According to its creator, Glenn McDonald, the graph is ever-evolving:
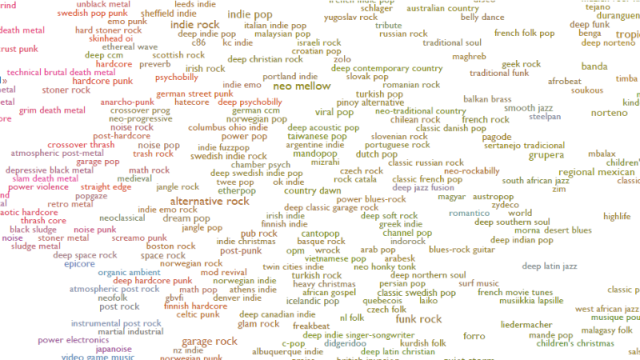
This is an ongoing attempt at an algorithmically-generated, readability-adjusted scatter-plot of the musical genre-space, based on data tracked and analysed for 1465 genres by Spotify. The calibration is fuzzy, but in general down is more organic, up is more mechanical and electric; left is denser and more atmospheric, right is spikier and bouncier.
To use it, just click on a genre to hear a sonic sample. Click on the little arrow next to the genre title, and get a whole map of representative artists. This is great for purposes of your own edification, but it’s also handy for those times when someone claims to like “all music except country”. (Oh, really? So you’re like super into vegan straight edge?)
Comments
2 responses to “This Scatter Graph Helps You Understand Virtually Every Genre Of Music”
I had no idea there were that many genres.
Apparently Dragonforce are melodic death metal…
Needs a bit of refining but a very decent effort.
I had no idea I was really into Zolo.