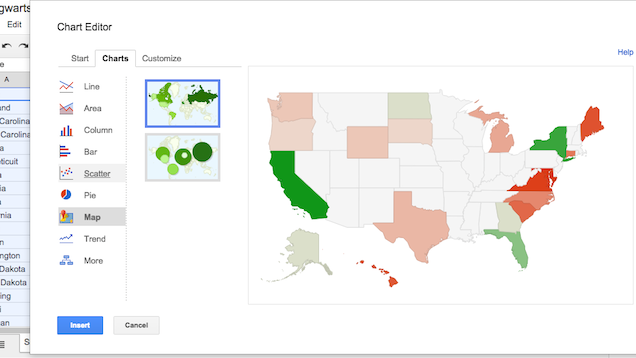
If you want to display a range of data by region, you need a GeoMap. You may not have known this, but it’s quite easy to create your own in Google Sheets after entering your data.
Highlight the data and go to Insert > Charts. On the charts tab of the new window you can select maps and choose which type of map you want. On the customise tab you can choose the colours and select which region you want. I created a map for the US, but you can choose to create a map for the world or a select number of other regions.
6 Powerful Google Drive Features You’re Probably Not Using [PC World]
Comments
One response to “Create Customisable GeoMaps With Google Sheets”
Anybody know if this is possible in Excel?